

Early-stage SaaS founders often know how much they spend on marketing, but they don’t always know what it costs to acquire a paying customer or how much profit that customer may generate over time.
That gap makes it difficult to decide whether to increase advertising, change pricing, improve onboarding, or focus on retaining existing customers.
CAC and LTV calculation for early SaaS starts with two questions: how much does it cost to acquire a customer, and how much gross profit can that customer reasonably generate during the relationship? The challenge is that early-stage companies rarely have enough historical data to answer the second question with confidence.
This guide explains the formulas, walks through a hypothetical SaaS example, and shows how to use conservative assumptions when your customer base is still small.
Table of Contents
Quick Answer: How Do You Calculate CAC and LTV for Early SaaS?
Customer acquisition cost (CAC) is the sales and marketing cost associated with acquiring new paying customers, divided by the number of those customers acquired during the same period.
CAC formula:
CAC = Total sales and marketing acquisition costs ÷ New paying customers acquired
Customer lifetime value (LTV) estimates the value a customer generates over the length of the relationship. For SaaS unit economics, a gross-margin-adjusted estimate is generally more useful than revenue alone.
Simplified SaaS LTV formula:
LTV = Monthly revenue per customer × Gross margin × Estimated customer lifespan in months
If you use monthly customer churn as a rough proxy for expected lifespan, the formula becomes:
LTV ≈ Monthly revenue per customer × Gross margin ÷ Monthly customer churn rate
This simplified formula assumes a relatively stable churn rate and revenue per customer. It can be misleading when a startup has few customers, rapidly changing retention, or significant expansion and contraction revenue.
The two metrics work together through the LTV:CAC ratio:
LTV:CAC = Estimated LTV ÷ CAC
CAC payback answers a different question: how many months of gross profit are needed to recover the acquisition cost?
Payback period = CAC ÷ (Monthly revenue per customer × Gross margin)
Use all three metrics together. A promising LTV:CAC ratio does not guarantee that your startup has enough cash to survive a long payback period.
What Is Customer Acquisition Cost (CAC)?
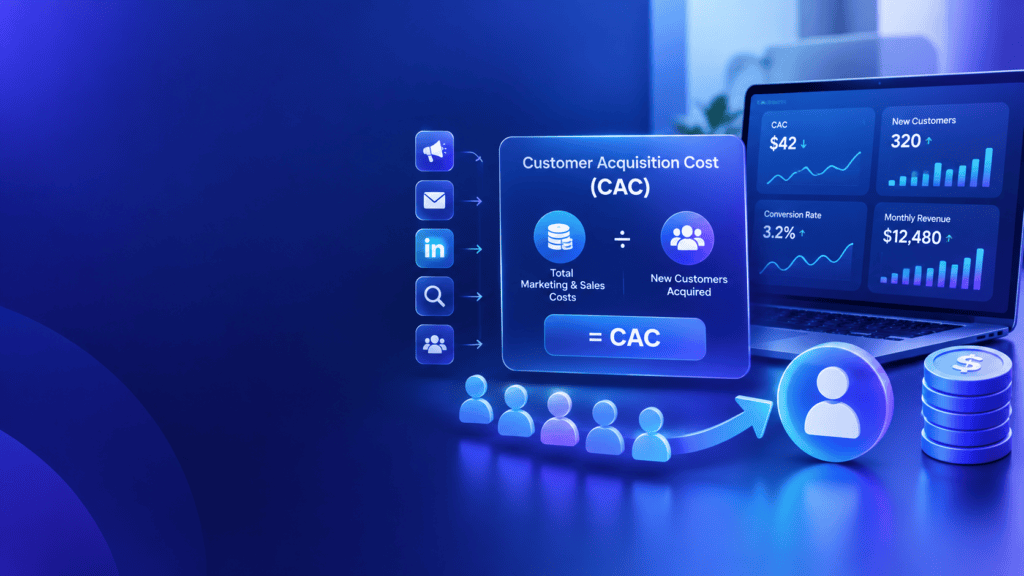
Customer acquisition cost measures the cost of acquiring a new customer. In SaaS, this usually entails the revenues from selling and marketing operations needed to turn a prospect into a paying subscriber.
Depending on your business model, those expenses may include:
- Paid search and social advertising
- Sales and marketing salaries
- Sales commissions
- Content creation and distribution
- SEO and demand-generation services
- Marketing automation and CRM subscriptions
- Sales contractors and lead-generation agencies
- Events, sponsorships, and relevant acquisition campaigns
The right cost definition depends on the question you’re trying to answer. A paid-ad CAC calculation is useful for evaluating an ad campaign, whereas a fully loaded CAC calculation offers a more comprehensive understanding of the economics of the acquisition.
Cash CAC versus fully loaded CAC
Consider a founder who personally writes content, contacts prospects, runs product demos, and closes early customers.
The company’s cash expenses could be low since the founder doesn’t get any extra money for every task. However, the founder’s time still has an economic cost.
For more accurate analysis, let’s calculate two metrics:
Cash CAC: Acquisition expenses actually paid during the period divided by the number of new paying customers.
Fully loaded CAC: Acquisition expenses plus a consistent allocation of relevant employee, founder, contractor, and tooling expenses divided by the number of new paying customers.
These two numbers have different purposes. Cash CAC helps estimate cash obligations, while Fully Loaded CAC demonstrates whether the company’s current acquisition strategy remains sustainable when employees take over tasks previously handled by the founder. Understanding the relevance of customer acquisition cost (CAC) for SaaS companies can help founders evaluate acquisition expenses and make more informed growth decisions.
Don’t confuse these two metrics together when comparing channels or months.
How to Calculate CAC for an Early-Stage SaaS
Start by selecting a measurement period, such as a month or quarter. Then calculate the acquisition costs and the number of new paying customers attributable to that period.
Hypothetical example
Suppose an early SaaS startup records the following monthly acquisition expenses:
| Expense | Monthly cost |
| Paid advertising | $3,000 |
| Content and SEO | $1,500 |
| Sales and marketing tools | $500 |
| Sales contractor | $2,000 |
| Total | $7,000 |
Assume the startup acquired 14 new paying customers during the month.
CAC = $7,000 ÷ 14 = $500
The startup’s calculated CAC is $500 per new paying customer under this expense definition.
The figure is not necessarily the cost of each customer acquired through advertising. Some customers may have arrived through organic search, referrals, or outbound sales.
For a channel-specific calculation, use the costs and customers attributable to that channel. For overall acquisition efficiency, use a consistent company-wide definition.
Should free trial users count as customers?
Not ordinarily when you’re calculating CAC per paying customer.
A free trial signup is a lead or trial user. A person who starts paying is a paying customer. These conversion events should be tracked separately because a channel can produce many trial signups but very few paid subscriptions.
For example, if a campaign costs $1,000 and generates 100 trial signups, the cost per trial signup is $10. If only five users become paying customers, the campaign’s direct cost per acquired paying customer is $200 before any additional allocated expenses.
This distinction is especially useful for freemium SaaS products, where the delay between signup and payment may be substantial.
What about founder time?
If the founder spent 20 hours acquiring those customers, record the hours even if no additional cash salary was paid.
For illustration, if you assign a hypothetical economic value of $50 per hour, the founder’s time represents $1,000 in acquisition labor.
A fully loaded calculation would then be:
($7,000 + $1,000) ÷ 14 = approximately $571 per customer.
The $50 hourly value is an illustrative assumption, not a market benchmark. Choose an appropriate rate for your business and use it consistently.
What Is Customer Lifetime Value (LTV)?
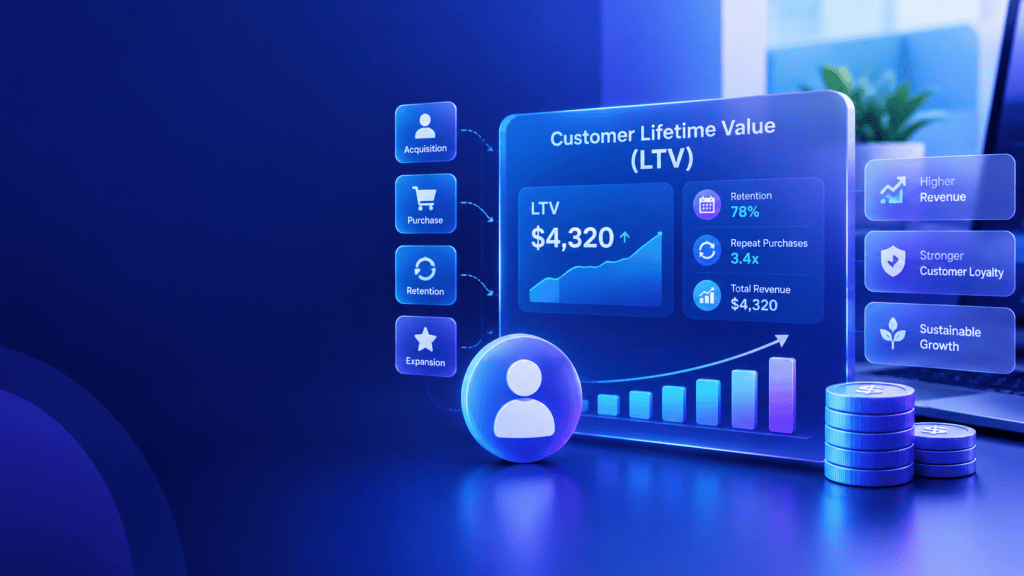
Customer lifetime value estimates how much value a customer generates over their relationship with your SaaS business.
The key question is whether you’re measuring revenue or profit.
A customer paying $100 per month doesn’t contribute $100 in gross profit if the company must pay for hosting, third-party services, customer support, and other direct service-delivery costs.
For this reason, founders should distinguish:
- Revenue LTV: Expected subscription revenue over the customer relationship.
- Gross-profit LTV: Expected revenue adjusted for gross margin.
- Contribution-based LTV: A broader measure that can subtract additional variable costs, depending on the company’s chosen definition.
For basic SaaS unit economics, gross-profit LTV is a useful starting point. Keep the definition consistent when comparing it with CAC.
Calculate gross margin first
Gross margin is the share of revenue remaining after the costs directly associated with delivering the service are deducted.
Gross margin (%) = (Revenue − Cost of goods sold) ÷ Revenue × 100
For a SaaS business, direct costs may include cloud infrastructure, usage-based services, and customer support or other delivery costs, depending on its accounting policy.
Suppose a SaaS product earns $10,000 in monthly subscription revenue and has $2,500 in direct service-delivery costs.
Gross margin = ($10,000 − $2,500) ÷ $10,000 × 100 = 75%
A 75% gross margin means the business retains $0.75 in gross profit for every $1 of revenue before operating expenses such as general administration, sales, and marketing.
How to Calculate LTV for Early SaaS
There are two useful starting methods. The correct answer depends on the information available.
Method A: Revenue per customer × lifespan × gross margin
Suppose your SaaS has:
- Average monthly revenue per customer: $100
- Estimated customer lifespan: 24 months
- Gross margin: 80%
Then:
LTV = $100 × 24 × 0.80 = $1,920
Under these assumptions, the estimated gross-profit LTV is $1,920 per customer.
The important word is estimated. If the business has only been operating for three months, it cannot directly observe a 24-month customer lifespan. The number has to come from the explicit assumption provided or the relevant data set.
Method B: Monthly revenue × gross margin ÷ monthly churn
When monthly customer churn is reasonably stable, a simplified expected lifespan estimate is:
Expected customer lifespan ≈ 1 ÷ Monthly customer churn rate
For example, a hypothetical monthly churn rate of 4% gives:
Expected lifespan ≈ 1 ÷ 0.04 = 25 months
If average monthly revenue is $100 and gross margin is 80%:
LTV ≈ ($100 × 0.80) ÷ 0.04 = $2,000
This method produces a gross-profit LTV estimate of $2,000.
The two approaches could yield different results as the assumptions about the life cycle are different. In the first case, it is explicitly stated as 24 months, whereas, the second case involves calculation of 25 months on the basis of 4% per month churn rate.
Neither is automatically more accurate. The value of the underlying assumptions is far more important than the precision of a mathematical formulation.
Why early churn data can be misleading
Suppose you have ten paying customers and none has cancelled during the first month. That doesn’t establish that your monthly churn rate is zero.
Your customers may not have experienced a renewal decision yet, or the observation period may simply be too short. Another issue with these annual plans is the lack of renewal behaviors.
Instead of assuming that customers will renew forever, consider a set of different churn assumptions and update these beliefs as new information comes in.
Worked Example: CAC, LTV:CAC, and Payback

Let’s combine the calculations for one hypothetical early-stage SaaS business.
Assume the startup reports:
| Metric | Assumption |
| Monthly sales and marketing costs | $12,000 |
| New paying customers | 20 |
| Monthly revenue per customer | $100 |
| Gross margin | 80% |
| Assumed monthly customer churn | 4% |
These figures are fictional and are used for illustrative purposes only, as an example of the formulas.
Step 1: Calculate CAC
CAC = $12,000 ÷ 20 = $600
It costs the company $600 to acquire each new paying customer under the stated cost definition.
Step 2: Estimate LTV
LTV ≈ ($100 × 0.80) ÷ 0.04
LTV ≈ $2,000
This is estimated gross-profit LTV, based on the assumption of stable 4% monthly customer churn.
Step 3: Calculate the LTV:CAC ratio
LTV:CAC = $2,000 ÷ $600 ≈ 3.33:1
The model estimates $3.33 in customer lifetime gross profit for every $1 spent acquiring the customer.
It does not mean they are generating $3.33 in net profit. That ratio does not account for costs such as R&D, administration, taxes, financing expenses, or other operating expenses.
Step 4: CAC payback
Monthly gross profit per customer = $100 × 0.80 = $80
CAC payback = $600 ÷ $80 = 7.5 months
The customer would need to generate approximately 7.5 months of gross profit to repay the acquisition fee, if revenue and gross profits remain stable.
The startup could experience cash-flow constraints if they pay for acquisition immediately, but receive subscription payments gradually, or if customers cancel early.
What does this example tell the founder?
The calculations are suggestive of a potentially attractive model, assuming that the estimates of churn and margin are correct.
But the result is only as reliable as the inputs. if actual retention is worse (e.g., materially higher churn), gross margins are lower than expected, or the costs of acquisition are higher than estimated, the ratio will deteriorate.
The next step is not automatically to increase marketing spend. First, evaluate actual retention, acquisition, and payback trends.
What Is a Good LTV:CAC Ratio for Early SaaS?
A 3:1 LTV:CAC ratio is commonly cited as a SaaS planning benchmark. It is a reference point, not a universal rule or a guarantee of profitability.
The right target depends on factors such as:
- Business-to-business versus consumer sales
- Subscription price and contract value
- Sales cycle length
- Gross margin
- Retention and expansion revenue
- Acquisition channel
- Cash reserves and payback period
- The reliability of the LTV estimate
A startup with a 3:1 ratio based on mature customer cohorts is in a different position from one whose ratio depends on three months of speculative retention data.
A very high ratio is not automatically ideal either. It may reflect efficient acquisition, but it could also mean the company hasn’t invested enough in customer acquisition to grow as quickly as it otherwise could.
Use the ratio as a diagnostic, alongside payback, retention, and cash runway.
How to Calculate CAC Payback Period
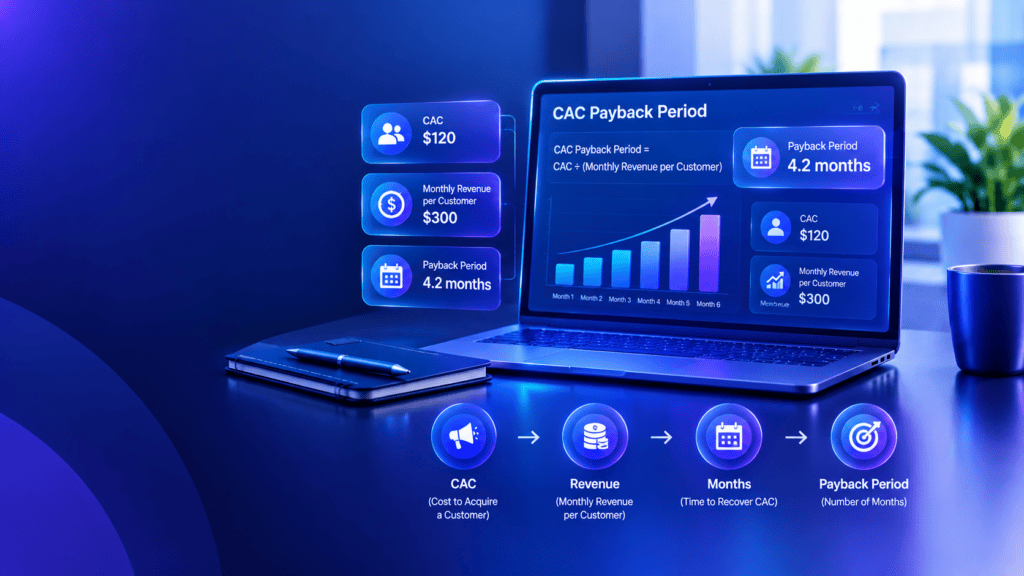
CAC payback estimates the number of months needed to recover acquisition costs through a customer’s gross profit contribution.
The simplified formula is:
CAC payback = CAC ÷ Monthly revenue per customer ÷ Gross margin
Equivalently, divide CAC by monthly revenue multiplied by gross margin.
For a customer with $600 CAC, $100 in monthly revenue, and an 80% gross margin:
Payback = 600÷(100 × 0.80) = 7.5 months
This is a simplified estimate. the actual payback period can be significantly affected by annual prepayments and discounts, onboarding costs, varying revenue based on usage, failed payments, and customer churn.
A payback period is especially important for a founder who has limited cash runway.A customer can have positive lifetime economics but still take too long to recover acquisition costs.
How to Estimate LTV When You Have Too Little Data
Early SaaS founders should treat LTV as a range until customer behavior becomes more predictable.
Build three scenarios
Use the same revenue and gross margin assumptions in each scenario, then vary churn.
For example, assume $100 monthly revenue per customer and an 80% gross margin.
| Scenario | Monthly churn assumption | Estimated gross-profit LTV |
| Optimistic | 2% | $4,000 |
| Base case | 4% | $2,000 |
| Pessimistic | 8% | $1,000 |
These are hypothetical scenarios, not benchmarks for early SaaS businesses.
The table shows why churn assumptions matter. Doubling the assumed monthly churn from 4% to 8% cuts the simplified LTV estimate in half.
Do not choose the optimistic scenario just because it supports your fundraising or marketing plans. Document the assumptions, compare them with observed customer behavior, and revise them as evidence improves.
Track cohorts instead of relying only on averages
A cohort is a group of customers who share a relevant starting point, such as the month they subscribed or the channel through which they were acquired.
Track each cohort’s:
- Number of new paying customers
- Revenue per customer
- Customer cancellations
- Gross margin
- Expansion and contraction
- Acquisition source
- Cumulative gross profit
This makes it easier to see whether newer customers behave differently from earlier customers.
For example, customers acquired through a discounted campaign may sign up quickly but cancel after the discount ends. Combining them with customers acquired through referrals could hide that difference.
When there are too few customers for a stable LTV estimate, focus on observable measures such as activation, trial-to-paid conversion, early retention, and actual gross profit to date.
CAC by Channel: Measure What Actually Works
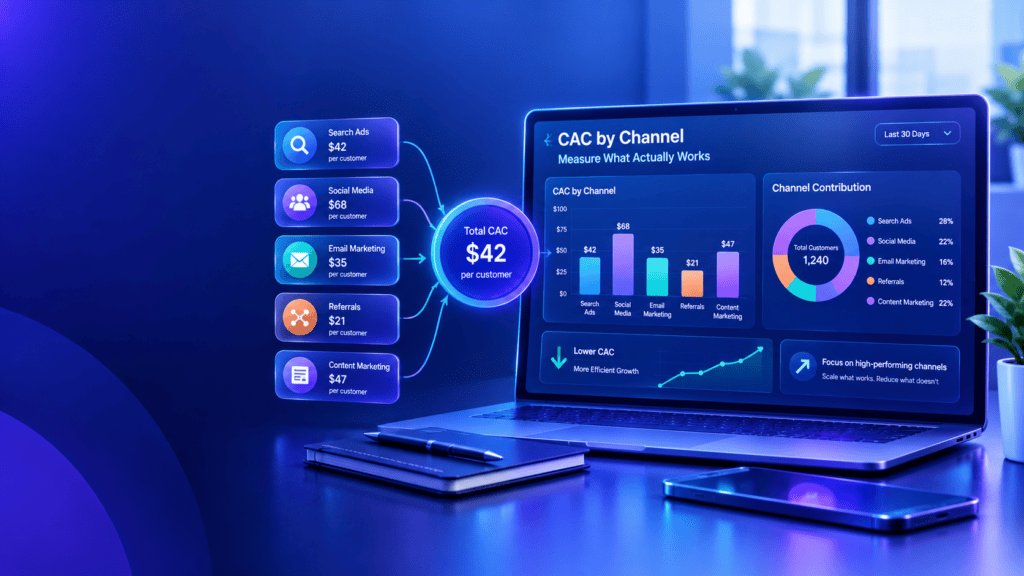
A blended CAC figure is useful for overall planning, but it can hide differences between acquisition channels.
Suppose a startup acquires customers through paid advertising, organic search, referrals, and founder-led outbound sales.
Each channel may have a separate cost structure and payback period. Paid ad campaigns require spending money on media, while organics require content and SEO investment. Referrals programs need to provide a reward, and sales-driven outreach will devour the time of founders and the sales team.
To compare channels fairly:
- Define what counts as an acquired customer.
- Use a consistent measurement period or attribution window.
- Allocate channel-specific costs consistently.
- I’ve written about the importance of tracking paying customers for growth marketers. We should instead focus on clicks or signups.
- Include relevant labor and tools in the fully loaded view.
- Review retention and gross profit by channel where the sample size permits.
Avoid interpreting the lowest CAC as the best channel without considering customer quality. A channel that’s cheap at the expense of quick cancellations is likely to have worse unit economics.
Also distinguish acquisition CAC from expansion economics. While upsells and cross-sells can provide significant additional revenue from existing customers, they should not be used to mask poor new-customer acquisition.
Common CAC and LTV Calculation Mistakes
Counting signups instead of paying customers
Signups measure interest or activation, depending on the event definition. They do not automatically represent acquired paying customers.
Excluding founder time without documenting it
Cash expenses can be useful for runway planning, but they may understate the economic cost of acquisition. Maintain a separate fully loaded view.
Using revenue instead of gross profit for LTV
Revenue LTV ignores the costs of serving customers. If gross margins materially vary by customer segment revenue-based comparison of LTV can be materially misleading
Treating a short observation period as a reliable lifetime forecast
A few weeks or months of data cannot establish a long-term retention pattern. Make sure to utilize explicit assumptions and conservative scenarios
Comparing inconsistent CAC definitions
Comparing paid-media CAC from one month with fully loaded CAC from another does not produce a meaningful trend.
Ignoring payback and cash runway
Even if estimated LTV exceeds CAC, the startup may run out of cash before acquisition costs are recovered.
Treating benchmarks as universal rules
A low-priced self-service SaaS product and a high-contract-value enterprise SaaS business have different acquisition economics. Apply benchmarks to provide context but do not substitute for company specific analysis.
A Monthly SaaS Unit Economics Checklist

Review the following metrics consistently, even if your startup is too early to estimate lifetime value with confidence.
- Total acquisition spending, with a documented cost definition
- New paying customers acquired
- Cash CAC and fully loaded CAC, where practical
- CAC by channel, when attribution is reliable
- Monthly revenue per customer
- Gross margin and direct service-delivery costs
- Customer churn and cohort retention
- Trial-to-paid conversion, if relevant
- Estimated gross-profit LTV with documented assumptions
- LTV:CAC ratio and CAC payback
- Cash runway and upcoming operating commitments
You don’t need a complex analytics platform to begin. A well-kept spreadsheet can be a good solution for a small customer base, as long as you have consistent definitions and calculations that are reconciled with your actual financial records.
Better billing data, product analytics, and cohort reporting will save you time as the company grows.
When Should You Improve Acquisition, Retention, Pricing, or Product Scope?
The metrics should help you choose what to investigate next.
If CAC is high: Examine channel efficiency, lead qualification, conversion rates, sales-cycle length, and the amount of labor required to close customers. Don’t assume the solution is simply to cut marketing expenditure.
If LTV is bad because of churn: Investigation areas include on-boarding, product activation, customer fit, support, and if customers are getting enough ongoing value to justify the subscription cost.
If gross margin is bad: Look at hosting and third-party usages costs, the effort/cost put into customer support, and anything else directly related to the cost of delivery. For AI-powered SaaS, usage-dependent inference costs may also matter.
If payback is too slow to meet your runway: Re-evaluation of spend on customer acquisition, changes to pricing, payment terms, and who you’re acquiring should be considered. A theoretically attractive LTV:CAC ratio might not help much if you have immediate cash constraints.
If the numbers are too uncertain: Invest in measurement and validation before scaling. Improved billing-event tracking, acquisition attribution, and customer retention data collection should be prioritized.
For founders pre-launch or trying to understand if demand for their product will materialize, Bkabhi’s SaaS idea validation guide contains similar advice on how to test their idea before a heavy investment of time and capital. For development budgeting, its SaaS MVP budgeting guide addresses a separate cost category: building the product itself.
These are complementary to, but not a replacement for, an examination of basic unit economics: acquisition costs, retention, and gross margins.
Conclusion: Make Decisions From Evidence, Not a Single Ratio

CAC and LTV help early SaaS founders understand whether customer acquisition could support a sustainable business. CAC is the cost of acquiring customers, and LTV is their economic value, while payback measures how long it takes to repay the investment in the CAC. The formula is simple, but the challenge is to provide reasonable inputs based on the company’s history.
It is essential to establish a consistent definition of CAC, measure LTV using the gross margin, and define the assumptions for calculating churn. It is also needed to evaluate the payback period for different groups of customers and update the metrics regularly based on the actual data.
Most importantly, a company should not confuse a promising ratio with the overall understanding of the situation. A growing LTV/CAC might be tempting to invest more into the marketing to acquire even more customers. However, before taking any significant steps, it is critical to evaluate the retention rates and cash flows in the customer base.
Author Bio
Jeevesh Tripathi
Researcher and technology writer at Bkabhi
Jeevesh Tripathi writes research-based content covering technology, AI, software, SaaS, and digital products. His work focuses on practical comparisons, evidence-based evaluation, and helping founders and technology teams understand product-development decisions without unnecessary jargon.
The editorial approach emphasizes source verification, clear explanations, and a distinction between documented facts, analytical conclusions, and recommendations.