
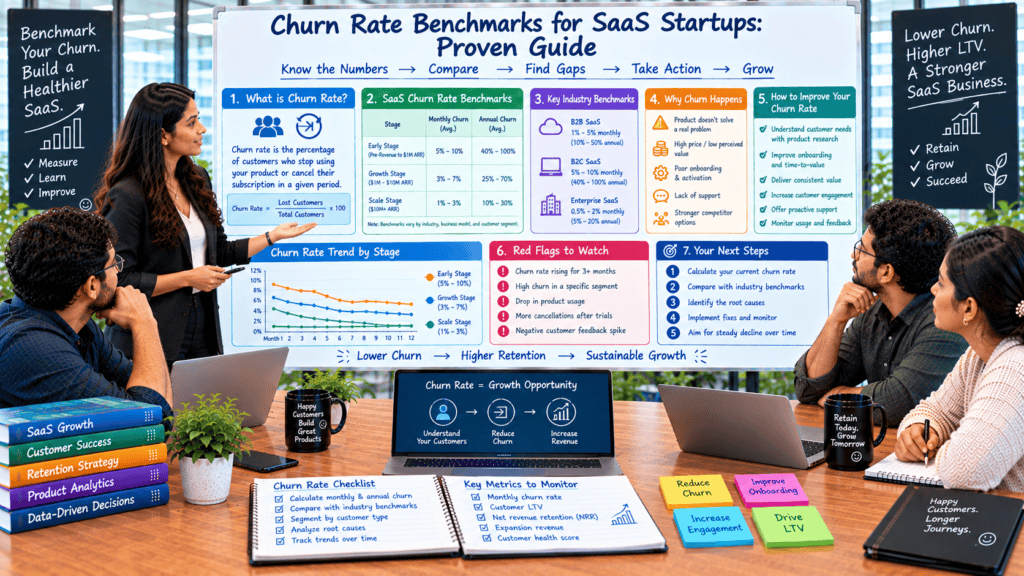
Table of Contents
Introduction: What Is SaaS Churn Rate?
SaaS churn rate refers to a percentage of customers or revenue that a Software-as-a-Service (SaaS) company loses over a period of time. Companies use this metric to evaluate the software’s performance, customer retention level, overall satisfaction, and other key areas. Therefore, the primary purpose of the SaaS churn rate is to display how successful the subscription service is at retaining paying customers.
Herewith, a high rate indicates poor performance, whereas a low rate implies the opposite. Typically, business owners calculate customer and revenue churn rates to see if any issues with their products are arising. Additionally, SaaS startups analyze it to keep an eye on the recurring revenue and establish whether customers are continuously using the software.
Why SaaS Churn Rate Matters for Business Growth
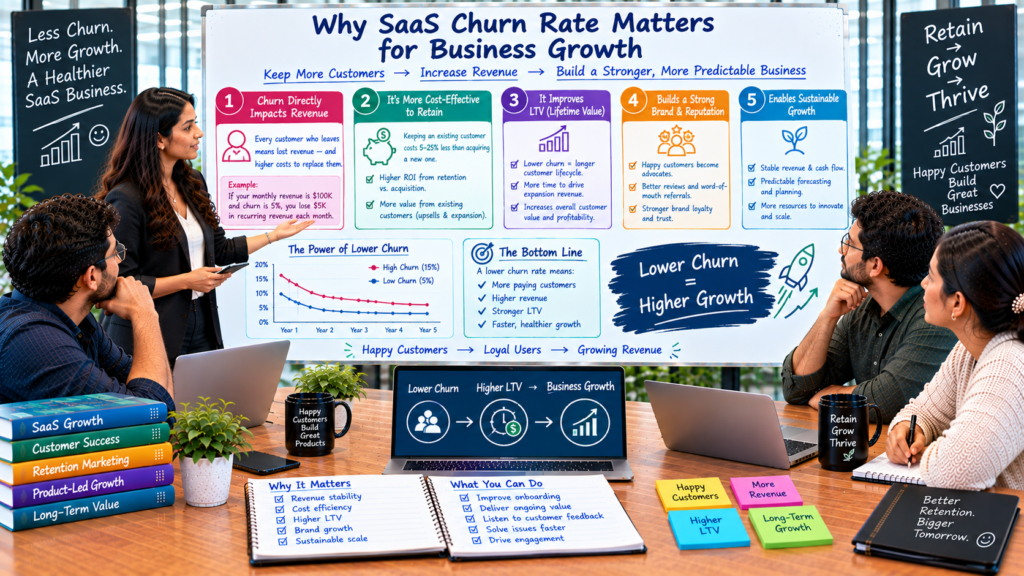
In the SaaS world, everyone loves to announce their new sign-ups. But the metric that determines whether your SaaS business will grow or shrink is its churn rate: the percentage of customers (or revenue) you lose during a specific period. If you acquire 100 new customers every month, but 100 of them cancel their subscriptions, you’re not growing.
What Is SaaS Churn Rate?
Churn rate is basically a percentage of customers who cancel or stop renewing their subscriptions during a certain period of time.
Mathematically, it can be expressed as
Customer churn rate = (Customers lost during period / Customers at beginning of period) 100
So, if 500 customers started their subscriptions in June and you only had 25 fewer customers in July it means that your monthly customer churn rate is 5%.
There are two main types:
- Customer (logo) churn: the number of accounts that leave.
- Revenue churn: the recurring revenue lost from cancellations and downgrades. Net revenue churn can even go negative when expansion revenue from existing customers exceeds losses.
1. Churn Directly Limits Your Growth
Growth can be calculated by subtracting the number of lost customers from the number of gained customers. High customer churn reduces the efforts of your sales and marketing teams since they have to constantly acquire new customers to replace the ones who left. So, if your company gains 100 new customers and 90 lost, your business only grows by 10 customers.
2. Retaining Customers Is Cheaper Than Acquiring Them
A new customer is expensive to acquire, and it may cost several times more than retaining an existing one if you consider the advertising budget, sales team costs, demos, and onboarding. Thus, every customer you keep is a customer you do not have to lose. A low customer churn rate helps you reduce your CAC payback period and profit.
3. Churn Shapes Customer Lifetime Value (LTV)
Customer lifetime value is directly linked to churn:
LTV ≈ Average revenue per customer ÷ Churn rate
So if your monthly churn is 5%, your customers stay with you for around 20 months (20/0.05). But if you can reduce it to 2%, their lifespan increases to 50 months (50/0.02). For many businesses, reducing churn by just a few basis points can make an enormous difference to the bottom line. After all, a healthy LTV:CAC (cost per acquired customer) ratio is generally considered to be 3:1 or higher.
4. Churn Compounds Over Time
Retention is fundamentally a compound interest process, in both directions. A business with low churn is building a compound growth engine, with a steadily increasing revenue base. A business with high churn can only constantly reinvest the same money.
A 5% monthly churn looks modest. It results in a 46% year-over-year customer loss. Still, a 22% decrease at 2% per month seems relatively insignificant, so many think that, say, 5% is a great result.
5. Investors Watch It Closely
Investors and acquirers rely on churn as one of the key indicators of product-market fit and business success. In this article, we are going to discuss how to measure and analyze gross and net retention, what a good customer churn rate is, and why a high customer churn is often a deal-breaker during financing or acquisition conversations.
6. Churn Reveals Problems in Your Business
Churn is a diagnostic tool. A spike often points to deeper issues:
- Poor onboarding or long ‘time to value’
- Product gaps or poor quality of product
- Inadequate support
- Unwise pricing
- Wrong target customer
- Too many and stronger competitors
Analyzing when and why customers leave gives you a clear roadmap for improvement.
7. Low Churn Unlocks Expansion Revenue
Happy, long-term customers have a demonstrated propensity to renew, upgrade, and cross-sell. This has the effect of an NRR (net revenue retention) of over 100%, which means you’re getting more revenue from your existing customer base every year — whether you acquire new customers or not. That is the hallmark of the most successful SaaS companies.
What Is a Good Churn Rate?
Benchmarks vary by segment:
- SMB-focused SaaS: 3–7% monthly churn is common
- Mid-market: roughly 1–2% monthly
- Enterprise: often under 1% monthly (5–10% annually)
The right target depends on your customer size, contract length, and pricing model, but lower is almost always better.
How to Reduce SaaS Churn
- Strategies to Reduce Churn in SaaS Products
- Here are some strategies to reduce churn in SaaS products.
- Onboard users better so that they get to their first “aha moment” faster
- Monitor health scores closely to spot accounts that may be at risk of churning and take remedial action.
- Ask them why they left. Use exit surveys. Ask people who cancelled why they decided to do so.
- Focus on customer success. Being proactive can help reduce churn.
- Make the best price for longer-term commitments. Customers who commit to annual payments rather than monthly are less likely to cancel.
- Reduce involuntary churn. If a customer’s card isn’t charged successfully, they will cancel. You can reduce this by managing your retry and dunning processes better.
- Constantly improve the product. Listen to customer feedback and release features that customers want.
- Cluster your customers into groups and see which sets are churning away. Focus your efforts on those segments.
Final Thoughts
Churn rate is a critical metric that reflects how well your product delivers value to its customers over time. It can make or break your company. By reducing it, you increase the lifetime value of each customer, alleviate pressure to acquire new customers faster, and improve the eyes of investors on your business model, as well as help establish compounding growth. Understanding your SaaS churn rate can also help you identify retention challenges and make more informed decisions about customer growth and revenue planning.
So if you want to grow your business, focus less on acquisition and more on retention. Plug the holes in the bucket before filling it up.
The Two Main Types of SaaS Churn
Understanding churn is critical for any B2B or consumer SaaS business. At its core, churn measures the rate at which you lose customers or revenue over a specific period. While it sounds like a simple metric, evaluating churn requires looking through two main lenses: Customer Churn (logos) and Revenue Churn (dollars).
1. Customer Churn vs. Revenue Churn: The Two Core Perspectives
To get an accurate picture of business health, SaaS leaders track churn using both logo count and recurring revenue.
Customer Churn (Logo Churn)
Customer Churn tracks the percentage or total count of accounts/subscribers that cancel their subscriptions within a given timeframe.
- Formula:
$$\text{Customer Churn Rate} = \left( \frac{\text{Customers Lost During Period}}{\text{Total Customers at Start of Period}} \right) \times 100$$ - Why It Matters: Customer churn reflects product-market fit, user engagement, and customer satisfaction. High customer churn indicates that users aren’t finding ongoing value in your product or that onboarding is failing.
Revenue Churn (MRR/ARR Churn)
Revenue Churn tracks the amount of Monthly Recurring Revenue (MRR) or Annual Recurring Revenue (ARR) lost from cancellations and downgrades over a given period.
- Formula:
$$\text{Revenue Churn Rate} = \left( \frac{\text{Lost MRR from Churned \& Downgraded Accounts}}{\text{Total Starting MRR}} \right) \times 100$$ - Why It Matters: Not all customers are worth the same amount. Losing five $10/month self-serve accounts impacts your business far less than losing one $5,000/month enterprise account. Revenue churn connects customer retention directly to financial sustainability.
2. Gross Revenue Churn vs. Net Revenue Churn
When evaluating revenue churn, SaaS companies break the math down further to measure total lost revenue versus net expansion.
| Metric | Focus | Formula | What It Measures |
| Gross Revenue Churn | Lost MRR Only | $\left(\frac{\text{Cancellation MRR} + \text{Downgrade MRR}}{\text{Starting MRR}}\right) \times 100$ | Total financial loss without factoring in customer expansion or upsells. |
| Net Revenue Churn | Lost MRR vs. Expansion MRR | $\left(\frac{(\text{Cancellation MRR} + \text{Downgrade MRR}) – \text{Expansion MRR}}{\text{Starting MRR}}\right) \times 100$ | Overall movement in recurring revenue from existing accounts. |
The Power of Negative Net Churn
Net Negative Churn occurs when Expansion MRR (upsells, cross-sells, account seats) from existing customers exceeds the MRR lost from churned accounts and downgrades.
When a SaaS business achieves negative net revenue churn, the business grows revenue over time even without adding a single new customer.
3. Voluntary Churn vs. Involuntary Churn
Beyond tracking what is lost, SaaS teams categorize churn by how it happened to take the correct preventative action.
                  ┌─────────────────────────────────────────┐
                  │            TOTAL SAAS CHURN             │
                  └────────────────────┬────────────────────┘
                                       │
                    ┌──────────────────┴──────────────────┐
                    ▼                                     ▼
        ┌───────────────────────┐             ┌───────────────────────┐
        │    Voluntary Churn    │             │   Involuntary Churn   │
        │  (Customer Intention) │             │ (Payment/System Failure)│
        └───────────┬───────────┘             └───────────┬───────────┘
                    │                                     │
       ┌────────────┴────────────┐           ┌────────────┴────────────┐
       ▼                         ▼           ▼                         ▼
 Poor Onboarding        Product Frustration Explored Card     Insufficient Funds
Voluntary Churn
Voluntary churn occurs when a customer actively chooses to cancel their subscription.
- Common Causes: Poor onboarding, lack of core feature usage, high pricing relative to perceived value, poor customer service, or switching to a competitor.
- How to Fix It: Improve customer onboarding, monitor product activity/usage triggers, run exit surveys, and deliver continuous value updates via Customer Success teams.
Involuntary Churn (Passive Churn)
Involuntary churn occurs when a subscription ends due to preventable payment failures, without explicit action or intent from the customer.
- Common Causes: Expired credit cards, maxed-out credit limits, outdated billing addresses, or bank fraud blocks.
- How to Fix It: Implement automated retry schedules (dunning management), send pre-expiration billing reminders, and integrate account updater services directly into your payment gateway.
Key Takeaways
- Track both logos and dollars: Customer churn tells you if users like your product; Revenue churn tells you if your business model is sustainable.
- Aim for Negative Net Revenue Churn: Focus on upsells and expansion within existing accounts to offset unavoidable cancellation losses.
- Fix involuntary churn first: Passive billing failures are often the easiest churn root cause to resolve using automated payment retries and dunning emails.
How to Calculate SaaS Churn Rate (With Formulas and Examples)
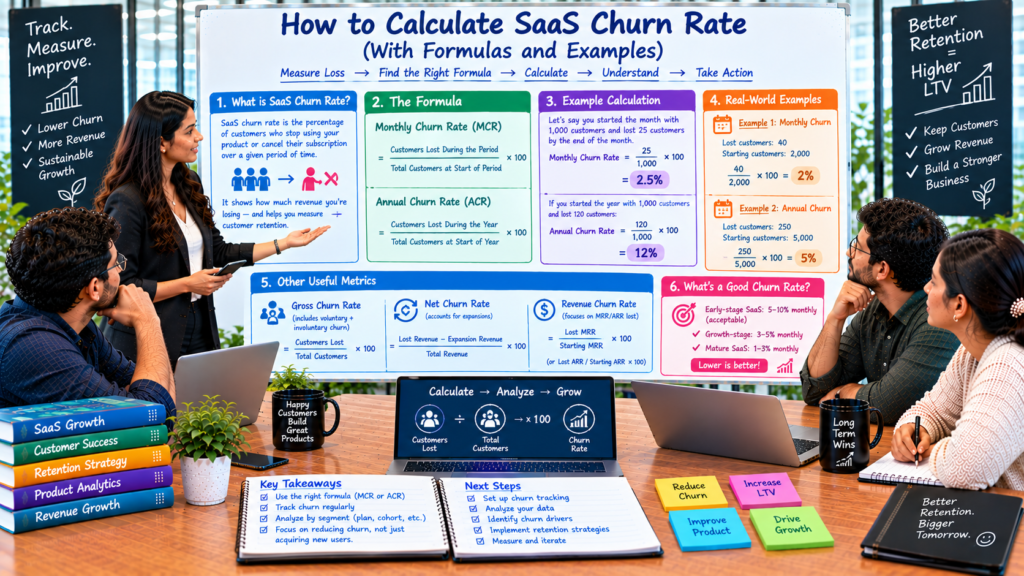
If you run a subscription business, few other statistical measures are as interesting as churn. It reflects your capacity to retain customers or, in other words, how many subscribers and revenue you lose during a specific period. Churn rate, therefore, has a direct impact on growth, cash flow, and company valuation. A business that sells software as a service (SaaS), for instance, is a perpetual churn engine unless it manages to constantly acquire new customers.
This article overviews the two types of churn and provides a numerical example that demonstrates how customer churn and revenue churn are calculated.
What Is SaaS Churn Rate?
Churn rate represents a ratio of customers (or revenue) lost during a given period of time (usually a month, quarter, or year). There are two basic methods for calculating the metric:
- Customer churn (sometimes called logo churn) calculates the percentage of customers lost.
- Revenue churn calculates the percentage of revenue lost and is a more accurate metric in cases where clients have varying payment amounts.
The two metrics are used together to get a full picture of the health of a SaaS business.l picture.
Customer Churn Rate Formula
Customer churn rate tells you what share of your customers left during a period.
Customer Churn Rate = (Customers Lost During Period ÷ Customers at Start of Period) × 100
Key points
- Customers at start of period is your starting point. Take your customer count at day one of the period.
- Customers lost is all those that cancelled or didn’t renew within the period.
- Make sure to exclude new customers acquired during the period from the calculation. Including them would cause you to report a lower churn rate.
Example
If you began the month with 1,000 customers and 30 of them cancelled:
Customer Churn Rate = (30 ÷ 1,000) × 100 = 3%
Converting monthly churn to annual churn
Don’t multiply monthly churn by 12, because each month’s churn applies to a shrinking base. Use this formula instead:
Annual Churn = 1 − (1 − Monthly Churn)¹²
With 3% monthly churn: 1 − (0.97)¹² ≈ 30.6% annual churn. That means you lose nearly a third of your customer base each year, which is why even small monthly numbers deserve attention.
Net Revenue Churn Rate Formula
Customer churn treats a $10/month customer and a $10,000/month customer the same. Revenue churn fixes that by measuring the dollars lost. There are two versions.
Gross Revenue Churn Rate
Gross Revenue Churn = ((Churned MRR + Contraction MRR) ÷ MRR at Start of Period) × 100
- Churned MRR: recurring revenue lost from cancellations
- Contraction MRR: revenue lost from downgrades
- MRR at start of period: your monthly recurring revenue on day one
Gross revenue churn can never be lower than 0%, and it ignores any revenue you gained from existing customers.
Net Revenue Churn Rate
Net revenue churn also accounts for expansion MRR: additional revenue from existing customers through upgrades, add-ons, extra seats, or cross-sells.
Net Revenue Churn = ((Churned MRR + Contraction MRR − Expansion MRR) ÷ MRR at Start of Period) × 100
Negative churn
If the revenues gained through expansion outweigh the losses from cancellations and downgrades, your net revenue churn is negative. In other words, it is the target revenue churn of every SaaS company. Your total revenue from customers grows despite the loss of some of them, which is possible without gaining any new ones.
Net revenue churn is closely related to Net Revenue Retention (NRR):
NRR = 100% − Net Revenue Churn
For example, 2% net revenue churn means 98% NRR, while −5% net revenue churn means 105% NRR.
SaaS Churn Rate Calculation Example
Let’s put it all together with a fictional company, CloudTask, a project management SaaS, for the month of March.
The data
| Metric | Value |
|---|---|
| Customers at start of March | 1,000 |
| Customers who cancelled | 30 |
| New customers acquired | 80 |
| MRR at start of March | $50,000 |
| Churned MRR (cancellations) | $1,500 |
| Contraction MRR (downgrades) | $500 |
| Expansion MRR (upgrades/add-ons) | $1,000 |
Step 1: Customer churn rate
(30 ÷ 1,000) × 100 = 3%
The 80 new customers are left out of this calculation. They only affect your ending customer count (1,000 − 30 + 80 = 1,050).
Step 2: Gross revenue churn rate
((1,500 + 500) ÷ 50,000) × 100 = 4%
CloudTask lost 4% of its starting recurring revenue to cancellations and downgrades.
Step 3: Net revenue churn rate
((1,500 + 500 − 1,000) ÷ 50,000) × 100 = 2%
Expansion revenue offset half of the losses, so net churn is 2%. Net Revenue Retention is 98%.
What if expansion were stronger?
Suppose CloudTask had $3,000 of expansion MRR instead of $1,000:
((1,500 + 500 − 3,000) ÷ 50,000) × 100 = −2%
That is negative churn. The company’s revenue from existing customers grew by 2% even after accounting for every cancellation and downgrade.
Reading the results
Customer churn (3%) is lower than gross revenue churn (4%), which means that the customers who left were on average somewhat bigger than average. It is a valuable insight that would be hidden otherwise.
What Is a Good SaaS Churn Rate?
Benchmarks vary widely by segment, but these are common rules of thumb:
- SMB-focused SaaS: 3–7% monthly customer churn is common
- Mid-market: roughly 1–2% monthly
- Enterprise: often under 1% monthly (around 5–10% annually)
Lower is always better, but compare yourself to companies with a similar customer size and pricing model, not to a universal number.
Common Mistakes When Calculating Churn
- Including new customers in churn calculation.
- Only calculate churn on period survivors.
- Multiplying monthly churn by 12. Use the compounding formula to calculate annual churn.
- Mixing period of time. Make sure to have the same time frame on your numerator and denominator.
- Ignoring revenue churn. You might be losing your most valuable customers.
- Not segmenting. Segment your churn analysis by plan, customer size, acquisition channel and signup cohort to identify problems.
How to Reduce Churn
Once you’re measuring it, here are proven ways to bring it down:
- Improve onboarding: customers who experience their first “aha moment” are much more likely to become lifelong customers
- Monitor product usage: usage is often a leading indicator that a customer is going to cancel
- Talk to churned customers: exit surveys and interviews help you understand why customers are canceling
- Upsell or cross-sell to customers: offer annual plans, and have them renew instead of canceling. Plans with a longer commitment have far fewer decision points throughout the year
- Prevent involuntary churn: failed payments are the largest source of churn for most companies, retry and dunning emails can reduce this type of churn
- Give customers a reason to keep paying you: expansion pricing, add-ons, and usage-based billing can turn net revenue churn negative.
Final Thoughts
Customer churn tells you how many people are leaving, gross revenue churn tells you how much money you are losing, and net revenue churn tells you whether your existing customers are growing your business.
Measure all three of these metrics consistently, segment these metric, and analyze trends regularly. Small improvements in retention always have an outsized impact on growth, far beyond any growth hacking or acquisition campaign.
I can also format this into a Word doc or a Markdown file, or add a meta description and SEO title if you’d like.
2025 SaaS Churn Rate Benchmarks
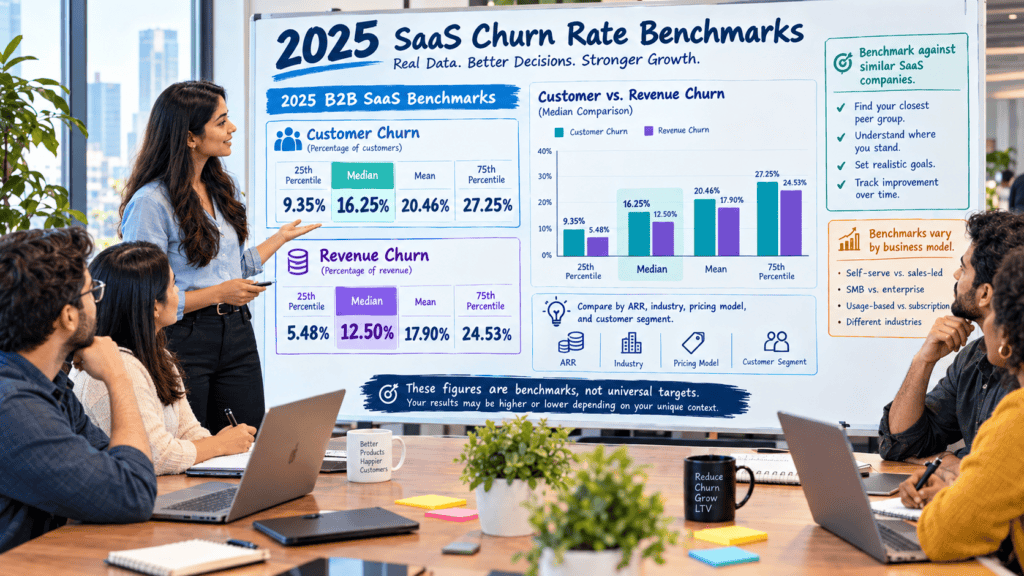
In the subscription economy, retention is the ultimate lever for valuation, capital efficiency, and scale. Churn benchmarks vary dramatically by GTM, contract value of the customer, and more.
Benchmark Snapshot
| SaaS Category | Monthly Churn Rate | Annual Churn Rate | Target NRR Range | Key Churn Driver |
| B2B SaaS (Overall) | 0.3% – 0.8% | 3.5% – 7% | 100% – 115% | Value realization, onboarding friction |
| SMB SaaS | 3.0% – 7.0% | 30% – 58% | 85% – 95% | Business failure rates, price sensitivity |
| Enterprise SaaS | 0.2% – 0.5% | < 5% | 115% – 130%+ | Champion turnover, slow deployment |
| B2C SaaS | 4.0% – 8.0% | 40% – 60% | 75% – 85% | Low switching costs, budget cuts |
| Freemium & Usage-Based | 5.0% – 10.0%+ | 50%+ | 110% – 140%+ | Lack of feature stickiness, usage fluctuations |
Detailed Breakdown by Segment
1. B2B SaaS Churn Rate
The general B2B SaaS benchmark is a median annual churn rate of 3.5% to 5%.B2B software has advantages over consumer software in that it typically includes multi-seat licenses, follows formal procurement processes, and has integrated operations, resulting in higher switching costs than its consumer counterparts.
- Gross Retention: Good B2B products retain 90%+ Gross Revenue Retention (GRR).
- Voluntary vs. Involuntary: Voluntary churn is ~2.6% per year while payment processing issues (involuntary churn) are ~0.8% to 1.0%.
- Impact: Companies with under 5% annual logo churn have 2x higher valuation multiples than companies on the higher end (>8%)
2. SMB SaaS Churn Rate
Targeting Small and Medium-sized Businesses yields a higher baseline churn rate, typically 3% to 7% monthly (30% to 58% annually).
- Why It’s Higher:SMBs face higher risks of insolvency, restrictive credit management, frequent executive transitions, and price sensitivity.
- Strategy:To compensate for the loss of logo, leading performing SMB SaaS companies utilize self-serve setup, low CAC, and expansion through automated add-ons.
3. Enterprise SaaS Churn Rate
Enterprise SaaS accounts represent the gold standard of retention, averaging less than 5% annual logo churn (often < 1% monthly).
- Net Revenue Retention (NRR): Since enterprise contracts include expansion through seats, cross sells and upsells, top enterprise SaaS companies can have 115-130%+ NRR rates, often referred to as negative net churn
- Key risks/reasons for churn: Churn in this segment is usually not driven by pricing, but by executive/champion turnover, long implementation periods or inability to demonstrate ROI.
4. B2C SaaS Churn Rate
Consumer SaaS (B2C) experiences high velocity with monthly churn ranging from 4% to 8% (40% to 60% annually).
- Dynamics: Consumers change subscriptions quickly during times of financial duress or once short-term needs are met.
- Fixes:Sustainable B2C SaaS requires massive top of funnel, aggressive discounting on an annual basis, and win-back/dunning automation.
5. Freemium and Usage-Based SaaS Churn
Usage-based models (e.g., API-based infrastructure, pay-as-you-go developer tools) and freemium conversions display unique retention characteristics:
- Freemium: Conversion rates from free to paid users are 2-5%. Paid users who don’t receive proper onboarding have a significantly higher risk of churning right after the upgrade, ranging from 5-10% or more per month.
- Usage-based: Revenues are tied to the level of customer activity. Logo churn can be close to zero, but a recession can reduce utilization by users, thereby decreasing revenues. Usage-based monetization usually has the highest NRR (>130%) due to the natural growth of customers.
Primary Drivers of SaaS Churn
- Involuntary Churn (Payment Failures): Expiring credit cards / decline codes are 15% to 30% of total churn and recoverable via automated account updaters + “smart retry logic”, capturing up to 1% of annual ARR.
- Onboarding Breakdown: Up to 80% of voluntary churn traces back to poor activation / time-to-value (TTV) during 30–90 day “first touch” period.
- Contract Length:Monthly contracts churn at 3x to 5x the rate of annual / multi-year contracts.
What Is a Good SaaS Churn Rate?
A good SAAS churn rate depends on many variables, such as the size of the company, specific pricing models, the target audience, and the nature of the product itself. For most of the early-stage SaaS companies, a monthly SAAS churn rate between 0-5% is considered good, while for more established businesses, it should be significantly lower.
For SaaS startups, there is usually some level of expected churn since the product-market fit is still being established. At the same time, if a company’s SAAS churn rate is consistently high, it might suggest that the product is not valuable enough or that the customers are not being properly onboarded or supported. The churn rate is not the sole metric that reflects the business’s health, as it is equally essential to consider expansion revenue, retention, and customer’s lifetime value. In this case, the best SAAS churn rate example would be a history of gradual improvement in the area, thus, slowly decreasing the SAAS churn rate.
Factors That Affect SaaS Churn Rates: A Detailed Guide

Churn, one of the most critical metrics for any subscription-based company. While 5% of monthly churn might seem like something you could easily live with, in a year it adds up to a whooping 46%. But before thinking about reducing churn, you have to know why it happens in the first place. These are the five most common reasons for customer churn and how they affect your business.
1. Company Size
Customer Churn in Different Company Sizes Report (Assessment)
The size of the customers’ companies has a significant impact on their likelihood to churn.
A company with a small budget has more reasons to cancel your service and less reason to continue working with you. For such organizations, every new project is associated with cost allocation and priority setting, while budget cuts deprives them of resources and features they have to do without.
Such companies are often highly skeptical and choose their tools carefully and quickly in the search for more cost-effective options. In this customer segment, the number of stakeholders involved in the decision-making process is also lower, which reduces the barrier to churn.
Mid-market companies are more stable in terms of budgets and processes but have a more cautious attitude towards renewals. At the same time, enterprises have the greatest difficulty renewing subscriptions due to the amount of data involved in the process.
Moreover, the responsibility for making decisions falls on a large group of people. The cost of errors is also much higher for these companies, which is why they try to minimize risks by working only with well-known providers and taking into account alternative options during the contract period.
Thus, when analyzing customer churn, it is critical to look at the composition of the segments and consider the reasons for churn. A decrease in the overall churn rate may well be due to changes only in the enterprise segment, while small businesses continue to leave due to high costs.
2. Pricing Model
How you charge affects both customer perception of value and the ease of leaving.
- The flat-rate pricing model is the simplest and most transparent one, but it leads to inevitable customer loss if the clients buy only a small amount of the company’s products or use its services sparingly.
- Pricing per seat can create a problem of churn rate as well if the company’s clients reduce the number of employees working with the product or cut the number of seats. Usage-based pricing is also a good option as it allows the clients to pay only for the resources they use; however, it can result in unexpected bills and encourage buyers to find cheaper alternatives.
- Tiered pricing can be a great choice as it allows clients to upgrade and get more benefits without overpaying. Nevertheless, the buyers can leave the companies when their activity level increases, and they are required to spend more money on the next tier. Finally, the Freemium pricing model attracts many customers with various offers as they allow individuals to get more for their money. However, there are many more users than those willing to pay for the products, which results in an increased churn rate.
Takeaway: Price around the value customers actually receive. When cost and perceived value drift apart, churn follows.
3. Contract Length
Contract structure has a mechanical effect on churn.
Monthlies induce the most churn, due to customers’ freedom to cancel at any moment. Though it attracts the most users, it results in the worst retention.
Annually billed contracts have lower churn, and better cash flow and revenue predictability. They usually have a price surcharge (10-20%), which some customers are not willing to pay.
Multi-yearly contracts are typically used in enterprise sales, to lock the customers in for good. They have the lowest churn, but it can be misleading, as it does not reflect customers’ true intentions.
The longer the contract lasts, the less likely it is to churn. But it does not address the reasons for churn. Use this to your advantage, by providing exceptional support during the support period, so that the customer renews the subscription willingly.
4. Customer Segment
Not all customers are equally suited to your product. Segment, whether by industry, use case, geography, or acquisition channel, has a major influence on retention.
- The fit of a product-market varies across different segments. Customers who fit within an ideal customer profile (ICP) tend to derive more value and stay longer within the product/service. Those who do not fit the ICP often exhibit a poor fit or “churn out” sooner.
- Industry types play a role as well- certain industries are seasonal, highly regulated, or volatile, which can impact the likelihood of renewal.
- Acquisition channel also impacts retention. Customers acquired through heavily discounted or “low-intent” channels can often be more at risk of churning than customers acquired on through more “high-touch” channels, such as referrals, content marketing, or SEO.
- Depth of use/use case also plays into retention and expansion potential. Customers who utilize a product for a core, daily use-case tend to realize more value and remain a customer for a longer duration, versus customers who use a product for an ancillary or infrequent use-case.
Takeaway: Retention starts at acquisition. Attracting the right customers is often more effective than trying to save the wrong ones.
5. ARPU (Average Revenue Per User)
ARPU and churn are tightly related, but the connection is often non-obvious.
Customers with low ARPU tend to churn more, since they are not invested much in the product and are easier to onboarding/offboarding. Additionally, they are less likely to be served by high-touch support, since it would be cost inefficient.
On the contrary, high-ARPU customers churn less, due to higher investment and more involved onboarding and account management. Also, there is an incentive to introduce more processes around the product for them.
Another factor is that the customer with low ARPU means lower budget for acquiring and servicing them. Therefore, any significant churn would make unit economics suffer. Upselling and expansion are great ways to increase ARPU, which in turn offsets the losses from churn, with possible net revenue retention (NRR) of over 100% for some companies.
The point is, that you want to track churn in relation to your ARPU. Increasing the lifetime value of your customers by transitioning them to higher tiers usually has a positive effect on both.
How These Factors Work Together
These factors are rarely considered in isolation. A smaller company, on a monthly basis, using a low-priced plan bought at a heavily-discounted rate, is a recipe for high churn.
An enterprise on a multi-year, high-ARR contract with extensive integration is a low-churn prospect. The best way to evaluate this is to segment your customer base using a cohort analysis and look at how churn distributes itself across different combinations of these variables.
Practical Steps to Reduce Churn
- Segment your churn data by company size, plan, contract length, and ARPU.
- Define and target your ICP to acquire customers with the highest likelihood to retain.
- Optimize the onboarding process to help customers achieve their first success with your product as soon as possible.
- Incentivize customers to choose an annual billing option.
- Make sure your product’s pricing model adequately reflects the value customers derive from using your product.
- Track customer health indicators such as login frequency, feature usage, and support tickets to identify at-risk customers and take remedial action promptly.
- Focus on upselling and cross-selling to increase your product’s ARPU and improve NRR.
Conclusion
SaaS churn is not random – it usually depends on factors such as customer segment, pricing policy, contract term, customer’s budget, and company size. If you analyze these segments, you will see exactly where and why you are losing customers and try to fix these issues.
I can also provide this information in Word or Markdown formats. Besides, I can edit it according to your requirements and provide you with a more extensive piece of text for your blog.
Why You Should Track SaaS Churn Against Industry Benchmarks
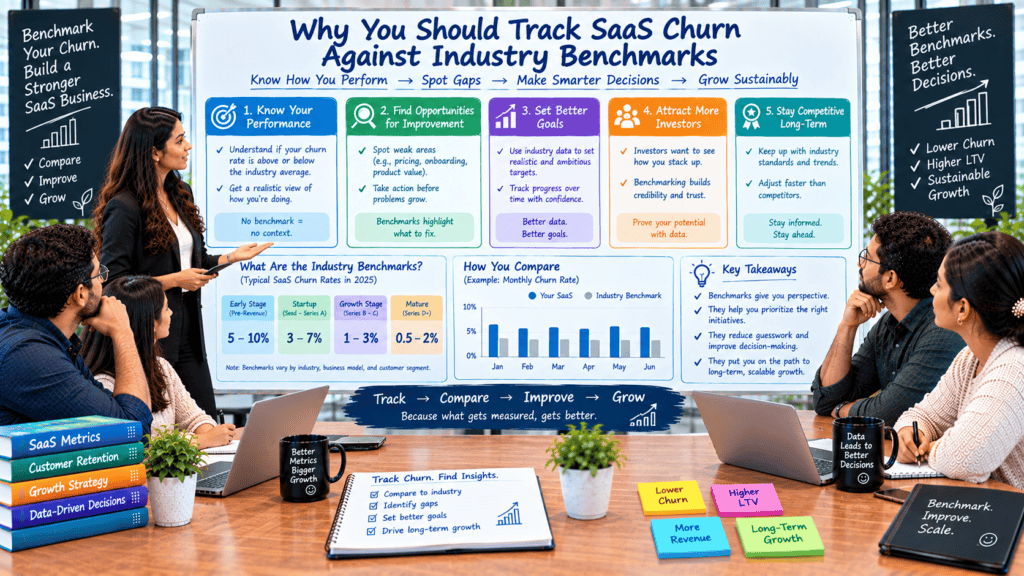
In SaaS, churn is the silent killer. A company may invest in aggressive acquisition tactics, but without careful management of attrition, new customers will simply flow out through the back door as quickly as they enter through the front.
While it is important to measure your company’s monthly and annual churn rates, it is an exercise in futility to analyze them in isolation.
If your monthly churn rate is 4%, this would seem to be a satisfactory number. However, such a figure can be catastrophic for your business depending on your business model.
Benchmarking your SaaS churn against industry standards can turn these numbers from meaningless figures into valuable sources of information for improving customer retention. Here’s why you should compare your SaaS churn rate to industry standards.
1. Benchmarks Reveal Context You Can’t See Internally
A single churn rate never tells the whole story. What constitutes a “good” churn rate varies drastically based on target market, Average Contract Value (ACV), and contract duration.
- SMB vs. Enterprise SaaS: SMB-focused platforms see higher monthly churn (3% to 5%) due to lower switching costs and higher business mortality rates. In contrast, Enterprise SaaS targeting big companies sees below 1% monthly churn.
- Contract Structure: Monthly self-serve plans have much higher voluntary churn than annual or multi-year enterprise contracts.
Why Benchmarking Helps:
If you sell enterprise software with an ACV over $50,000 and your annual gross churn is 12%, your internal growth trends may be hiding your danger. Looking at your trends versus industry benchmarks can show you that top enterprise SaaS companies keep churn under 5% on an annual basis, exposing a product-market fit or onboarding issue.
2. It Helps Differentiate Product Health from Payment Friction
Not all churn is caused by dissatisfied customers. Industry benchmarks separate churn into two distinct categories:
- Voluntary Churn: Customers that cancel by their own accord due to poor onboarding, disengagement, or migration to a competing business.
- Involuntary Churn: Customers that are canceled by the company due to reasons out of the customer’s control i.e. passive payment failure or expired credit card.
| Churn Type | Industry Median Benchmark | Primary Root Cause | Core Fix |
| Voluntary Churn | ~2.0% – 3.0% annually | Poor onboarding, product-market mismatch | Better ICP targeting, activation milestones |
| Involuntary Churn | ~0.8% – 1.2% annually | Expired cards, payment gateway declines | Automated dunning, smart retry logic |
Why Benchmarking Helps:
If your involuntary churn is significantly higher than the industry benchmark (~1%), it means your business has a payments operations issue, not a product one. Benchmarking enables you to make tactical improvements (e.g. smarter dunning) rather than expensive product changes that may turn out to be unnecessary.
3. Churn Directly Drives Your SaaS Valuation Multiple
Investors and buyers typically perform rigorous cohort and retention analyses as part of due diligence.
They care deeply about Logo Churn (accounts lost) and Gross/Net Revenue Churn (value lost vs. expansion).
Consider two SaaS companies with identical $6M ARR and identical 25% annual growth rates:
- Company A:2% annual logo churn, 118% Net Revenue Retention (NRR).
- Company B:8% annual logo churn, 94% Net Revenue Retention (NRR).
Even with equal top-line revenues, Company A is worth much more in terms of ARR multiple because its compounding retention is predictable in the long term while Company B has to continuously invest in revenues that leak away (the “leaky bucket”).
High Churn  --> High CAC Pressure --> Lower LTV:CAC Ratio --> Lower Valuation Multiple
Low Churn   --> Compound Expansion --> Premium LTV:CAC Ratio --> Higher Valuation Multiple
Why Benchmarking Helps:
Tracking your Net Revenue Retention (NRR) against top-quartile industry standards (typically 110%+ for B2B SaaS) ensures you build enterprise value long before entering funding or acquisition discussions.
4. It Focuses Your Capital and Resources Where They Matter Most
Benchmarking acts as an operational diagnostic tool. When your churn rate deviates from segment benchmarks, it signals precisely where in the customer lifecycle you need to deploy capital:
- First 30-90 Day Spike: If early cohort churn is significantly higher than the benchmark, it means that either your Time-to-First Value (TTFV) is too long or your onboarding process is flawed.
- Mid-Contract Churn: If there is a substantial increase in churn during the lifecycle of the contract, it suggests that customer success teams are not actively tracking customers’ usage health scores.
- Pre-Renewal Churn: If a large number of subscribers cancel their subscriptions just before the renewals are due, it indicates that there is an issue with account adoption or executive ROI demonstration.
Why Benchmarking Helps:
Instead of guessing why revenue is leaking, benchmarking points directly to the broken operational lever—whether that is ICP refinement upstream in sales, product onboarding, or retention save flows.
Key Takeaways for SaaS Operators
- Normalize by Segment:Compare your metrics again peer companies with similar ACVs, billing frequencies (monthly vs. annual), and target markets (SMB, Mid-Market, Enterprise).
- Track Both Logo and Revenue Retention:Low logo churn with high gross revenue churn implies that you’ve had some churn of larger enterprise accounts, who are downgrading.
- Aim for Negative Net Revenue Churn:Best-in-class SaaS companies utilize expansion revenue (upsells, cross-sells, seat expansion) so that existing cohorts eventually grow over time, despite cancellations
How to Reduce SaaS Churn and Improve Retention
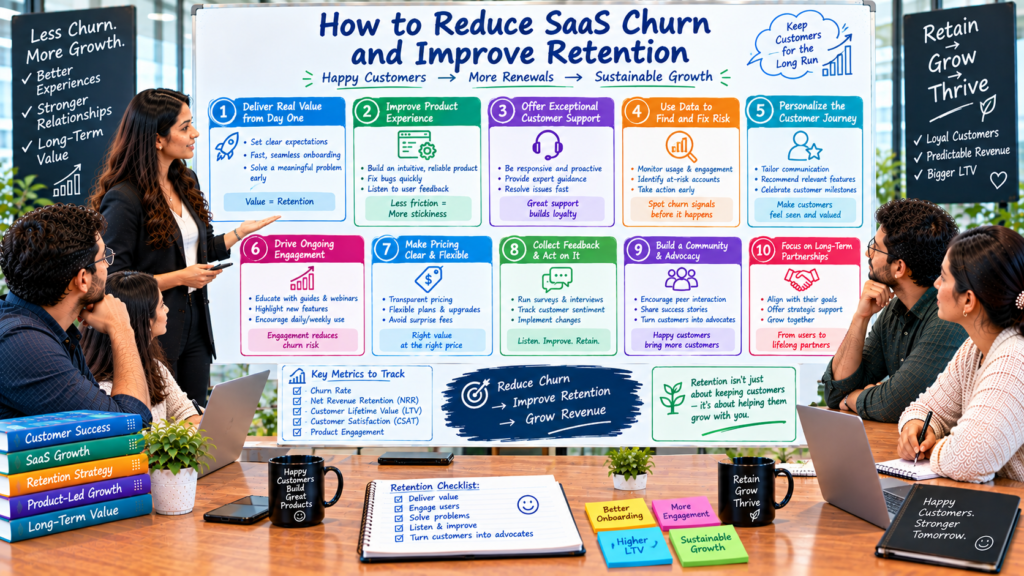
Reducing SaaS churn will demand a continuous focus on customer requirements, the product offering and the overall end-user experience. There are a number of tactics that SaaS companies can implement to help retain their customers and improve their experience.
- Investment in Customer Success: The customer success team should be proactive by providing onboarding and other support services to the customers. By doing this, the support team can ensure that their clients adopt the product and succeed in their journey.
- Flexible Plans and Pricing: Offer plans and pricing that can grow with the customers. Doing this would help retain clients who might want to upgrade their plans rather than switching to a different company.
- Pause Option: Some customers could be willing to pay for a service they are not using. Hence, companies can set a timeline on subscriptions so that clients can cancel their subscriptions when they are done with a particular period.
- Loyalty and Rewards: Customer loyalty programs should entice clients to continue using the company’s products and services. The reward or discount can be given through bonuses, additional features, or credits that are only available to long-term subscribers.
- Simplified Billing & Payments: Companies should make it as easy as possible for the customers to pay for the products or services they have subscribed to. Doing this would reduce involuntary churn significantly. This can be achieved by sending out payment reminders to the clients and having an option for them to choose how they will be billed. The company could also ensure that there is no failed payment in the system.
Together, these strategies help SaaS companies address both customer dissatisfaction and preventable cancellations while creating a smoother, more valuable customer experience.
How FP&A Teams Can Help Reduce SaaS Churn
SaaS retention is not only a matter of Customer Success – it’s a financial matter. If Customer Success teams are managing their relationships with customers and Product teams are tracking feature adoption throughout the customer journey, it’s an FP&A team’s job to collect and analyze relevant financial information to prevent customer churn.
Here is how FP&A can reduce SaaS churn with Proactive Customer Analysis, Strategic Forecasting, and LTV/CAC Optimization.
1. Proactive Customer Analysis: Spotting Red Flags in the Data
FP&A teams naturally sit at the intersection of billing, usage, and financial metrics. By looking beyond high-level Revenue Retention rates, FP&A can identify operational indicators of churn risk.
- Usage-to-Value Metrics: Combine product telemetry with billing data to understand cost per user/feature utilization to MRR/ARR. If a customer underuses a product feature relative to what they’ve subscribed to, mark them as “at risk” of churn in the FP&A.
- Payment & Invoice Friction: Customers that pay late or dispute invoices are more inclined to churn. By analyzing A/R aging and cross-referencing it with historical churn data, you can build rules of thumb of how many days past due do customers churn at (ex: 45+ days).
- Cohort Health Modeling: Use your FP&A team to model cohort survival curves by distribution channels, company size, length of term, and initial discount rate. By analyzing these trends, you may identify that customers who signed up via a particular channel with a steep discount are churning at twice the rate of the average customer after 12 months.
2. Strategic Forecasting: Scenario Planning for Customer Health
Forecasting shouldn’t just predict where churn will land; it should model the financial impact of retention initiatives to guide executive strategy.
- Cohort-Based Churn Projections: Instead of using a blended churn rate across all revenue, your FP&A team can build a forecast that rolls out different churn rates depending on how far a customer is in their lifecycle. For example, they could use one churn rate for customers in their first 3 months (onboarding) and another for customers well into their 2nd year.
- Early Warning Impact Modeling: Your FP&A team can do scenario modeling of the impact that different levels of voluntary churn would have on your ARR. This will help the executive team understand what investments (more customer success people/organization, more investment in their onboarding tool, etc) they need to make to hit their churn goals.
- Contraction vs. Expansion Forecasting: Your FP&A team can separate churn projections into down-sells (contraction) vs cancellations. This will help you see if customers are cutting back on their usage of your product before completely walking away. The business can then make adjustments to either entice those customers to expand or at least get more value out of their current plan.
3. LTV/CAC Optimization: Allocating Resources to High-Value Segments
Not all churn is equal. Losing a high CAC, low margin customer, hurts differently than losing an efficient, high expansion account. FP&A helps the organization to optimize its retention spend based on the highest Return on Investment (ROI).
- Granular LTV/CAC Segmentation: FP&A can segment Customer Lifetime Value to Lifetime Acquisition Cost ratios by customer type, vertical, and plan tier. If mid-market customers of a certain plan tier yield an LTV/CAC of 5:1 with low churn while enterprise customers on a custom onboarding plan yield 1.5:1 with high churn, then FP&A can advise leadership on where to focus sales and retention energies.
- Optimizing Discounting & Renewal Terms: FP&A can evaluate the long-term impact of pushing multi-year contracts versus monthlies or annuals and determine the optimal balance between securing a customer for the long-term and maintaining gross margins by modeling the net present value of the former against the latter.
- Payback Period Realignment: FP&A tracks the Customer Acquisition Cost Payback Period across channels and can advise leadership when a channel should be cut or reworked if its CAC Payback Period greatly exceeds average customer lifespan (e.g., 24M vs. 18M).
The Strategic Takeaway
By transforming from passive reporting to active financial intelligence, FP&A turns from a ledger liability into a critical driver of SaaS unit economics. By binding together financial data with usage data, FP&A creates an intervention mechanism for Customer Success and Revenue to act early and often in order to protect recurring revenue and drive business value.
SaaS Churn Rate and Revenue Forecasting
SaaS churn rate is essential for revenue forecasting because it illustrates the potential decrease in recurring revenue from customers. Therefore, an increase in the churn rate can impact the Monthly Recurring Revenue (MRR) and Annual Recurring Revenue (ARR) and reduce growth, even if the company gains consistent new customers.
To forecast revenue, an organization should consider the current amount of recurring revenue, acquisition rate, average revenue per customer, and projected churn rate. For example, if the company has one thousand customers and a five percent monthly churn rate, approximately fifty clients will cancel every month if the trend continues. It means that the company should adjust the revenue projection for the predicted attrition and use it for future growth planning.
In general, analyzing the churn rate along with new sales and expansion revenue helps understand the potential revenue trajectory, illustrate revenues at risk, and plan retention activities.
How Churn Impacts SaaS Growth and the Rule of 40
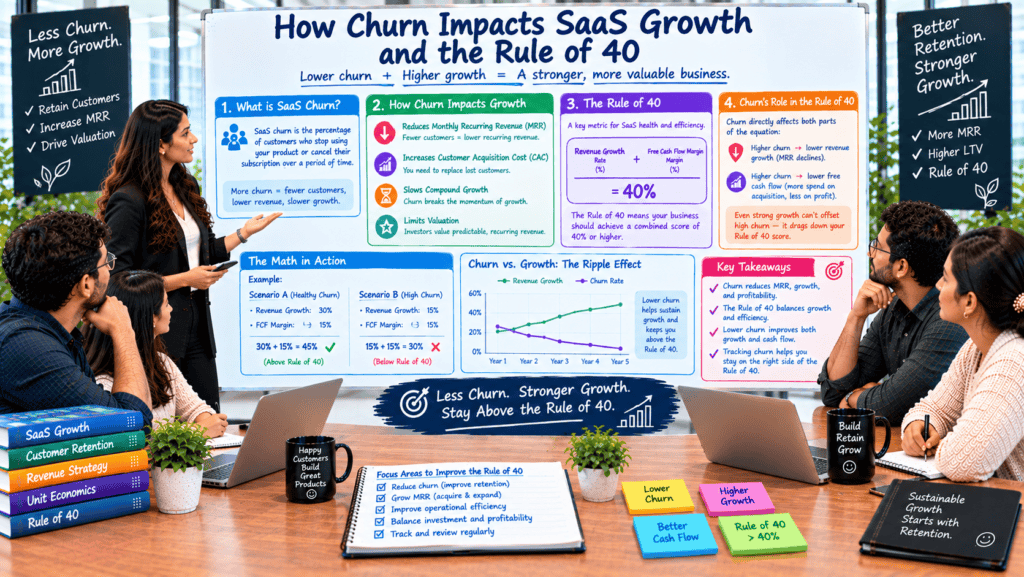
For SaaS companies, revenue growth is often viewed as the primary measure of success. However, high top-line growth is unsustainable without a strong focus on retention. Churn—the percentage of recurring revenue or subscribers lost over a given period—acts as a direct drag on growth and heavily compromises a company’s performance against the Rule of 40.
Understanding how churn influences both metrics reveals why customer retention is a core financial driver for scalable SaaS operations.
1. How Churn directly Inhibits SaaS Growth
In a Subscription Revenue Model, growth is the result of not only adding new users (New ARR/MRR) but also the net impact of customers who have churned off.
$$\text{Net New ARR} = \text{New ARR} + \text{Expansion ARR} – \text{Churned ARR}$$
The “Leaky Bucket” Effect
Getting new customers while losing a bunch of existing ones is like drinking from a fire hose. If your company is targeting $20\%$ annual growth, but you’re seeing $15\%$ annual churn, you’re going to have to acquire $35\%$ in new revenue just to meet your net growth target.
Escalating Customer Acquisition Costs (CAC)
Replacing lost revenue requires continuous marketing and sales spending. When churn is high:
- CAC Payback Period Lengthens: Money spent acquiring lost customers is never fully recovered.
- LTV:CAC Ratio Deteriorates: Lifetime Value ($\text{LTV}$) drops proportionally as average customer lifespan shortens ($\text{Lifespan} = \frac{1}{\text{Churn Rate}}$).
Loss of Compound Growth and Expansion
In healthy SaaS markets, the existing customer base grows by selling more seats, doing upsells and cross-sells to existing clients and therefore expanding the overall account size (net retention rate in excess of 100%). Churn kills this expansion and the company is forced to acquire new clients cold.
2. Understanding the Rule of 40
The Rule of 40 is a financial standard, which is used by growth-stage SaaS companies and their investors to evaluate the financial health of the business. The rule helps to understand the balance between revenues growth and profit level.
$$\text{Rule of 40 Metric} = \text{Revenue Growth Rate (\%)} + \text{Profitability Margin (\%)} \ge 40\%$$
- Growth Rate: Usually a YoY (Year-over-Year) ARR or Revenue growth is measured.
- Profitability Margin: EBITDA Margin or Free Cash Flow (FCF) Margin are commonly used to measure it.
A combined score of 40% or higher usually implies a satisfactory balance between aggressive scaling and profitable operations.
3. The Impact of Churn on the Rule of 40
Churn simultaneously undermines both components of the Rule of 40 equation, making it extremely difficult to maintain a healthy score.
                    ┌─────────────────────────┐
                    │       HIGH CHURN        │
                    └────────────┬────────────┘
                                 │
           ┌─────────────────────┴─────────────────────┐
           ▼                                           ▼
┌───────────────────────┐                   ┌────────────────────┐
│   Depresses Growth    │                   │ Erodes Margins     │
│   Rate (%)            │                   │ (%)                │
├───────────────────────┤                   ├────────────────────┤
│ • Lowers Net ARR      │                   │ • Higher Sales/Mkt │
│ • Prevents Expansion  │                   │   Replacement Cost │
│ • Compounding Deficit │                   │ • Reduced LTV/CAC  │
└──────────┬────────────┘                   └─────────┬──────────┘
           │                                          │
           └─────────────────────┬────────────────────┘
                                 ▼
                    ┌─────────────────────────┐
                    │ Pulls Rule of 40 Score  │
                    │      Below Target       │
                    └─────────────────────────┘
A. It Suppresses the Growth Component
When Gross Churn increases, Net New Revenue decreases. So even if your top-of-the-funnel acquisition is great, your net growth slows. That means a decrease from 35% growth to 15% growth would lower your Rule of 40 score by 20 points.
B. It Compresses the Profitability Component
To compensate for lost revenue and keep top-line growth artificial high, companies are forced to overspend on Customer Acquisition (Sales & Marketing).
- S&M expenses rise relative to revenue.
- EBITDA and Free Cash Flow margins decline or turn deeper negative.
- Profitability drops, further lowering the total score.
Summary Impact Matrix
| Metric Impact | Low Churn (High Retention) | High Churn |
| Net Revenue Growth | High (Boosted by Net Expansion) | Low/Stagnant (Dragged down by loss) |
| CAC Efficiency | High (Revenue compounds naturally) | Low (Constant replacement spend) |
| FCF / EBITDA Margin | Strong (Predictable recurring cash flow) | Weak (Depleted by high acquisition costs) |
| Rule of 40 Score | Easily meets or exceeds 40% | Struggles to maintain 40% |
Key Takeaway for SaaS Strategy
Churn is not only a customer success metric, but also a financial engine driver. By reducing churn, you will be able to restore the growth of your top line and free up cash to allow capital-efficient growth and to clear the Rule of 40 benchmark.
How to Identify Customers at Risk of Churning
Recognizing customers who are about to churn enables a SaaS company to retain the users and keep their recurring payments. The critical point is to assess the changes in customers’ behavior on an ongoing basis and respond promptly to the emerging trends. First, it is essential to track users’ activity and engagement with the product. Typically, a sudden decrease in total users or those engaged with specific functions may indicate dissatisfaction with the product.
Moreover, the support system can provide useful data on customers’ behavior by analyzing the frequency of tickets and interactions with support. An increase in complaints, critical issues, or unresolved claims may suggest that the user is dissatisfied with the product. Other red flags include failures in payment processes, downgrades, a reduction in seats, or late renewals.
After identifying active customers and those who are highly engaged and likely to renew, business should establish a customer health score. In doing so, companies can actively manage the at-risk users by providing additional support, onboarding assistance, or other engagement activities to keep the customer.
A strong conclusion for a blog post on SaaS retention needs to reinforce key takeaways, highlight the business value (like lower Customer Acquisition Cost and higher Customer Lifetime Value), and provide a actionable closing thought or call-to-action (CTA).
Here is a ready-to-use draft for your blog’s conclusion section, structured specifically for a technical/startup content audience:
Conclusion: Building a Strong SaaS Retention Strategy
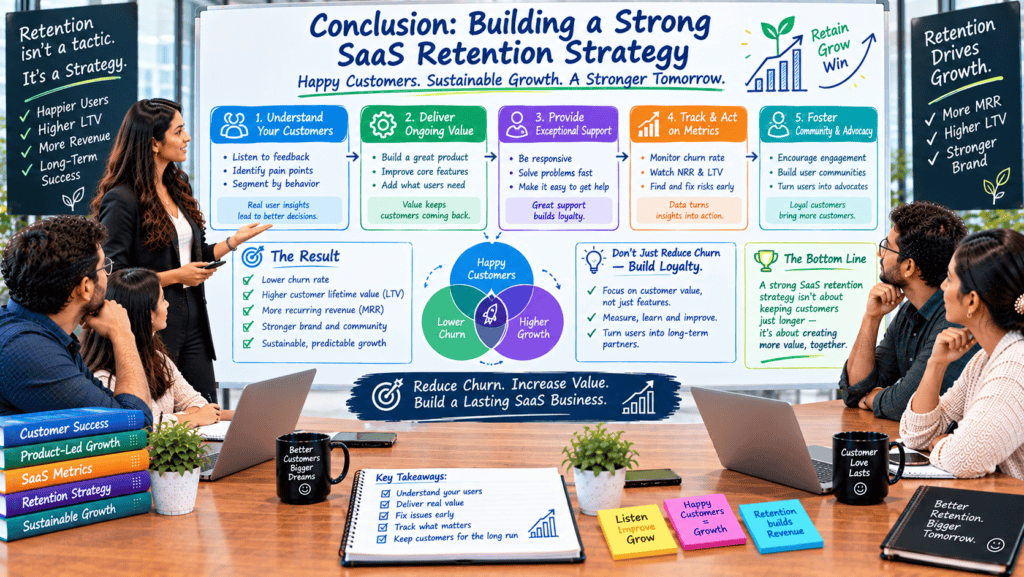
While acquiring new users may drive an initial spike in growth, retaining existing customers is the surest way to guarantee the sustainable growth of your SaaS business. After all, the competition is tough, and you need to do everything possible to keep the ones you have attracted. A well-thought onboard process, smart usage of product analytics, optimization of feature usage, and proactive customer success management can all help you turn first-time visitors into lifelong customers.
Key Takeaways to Act On Today:
- Focus on Time-to-Value (TTV): Streamline the onboarding to make users experience the product’s value asap
- Monitor health metrics proactively: don’t let your product die – track its vital signs and attempt to identify and resolve issues before they lead to a cancellation
- Make decisions based on feedback: collect and analyze product feedback, NPS surveys, and feature requests to make the product better and more aligned with the users’ needs
- Build a retention loop: Retention is a repetitive, cyclical process that occurs throughout a user’s lifecycle with your product, not a one-time task
Reducing churn by even 5%, profits can increase by anywhere between 25% and 95%. By focusing less on rapid acquisition and more on retention you create a steady, sustainable revenue stream that will continue to grow and evolve.
What’s Next?
Ready to optimize your SaaS product strategy? Audit your current onboarding funnel, identify your highest-churn drop-off points, and start implementing structured customer feedback loops today.
Author Bio
Jeevesh Tripathi works as a technical content creator and writer for BkAbhi, focusing on SaaS and software engineering topics such as SaaS architecture, software engineering and product development workflows, and building and scaling startups. He has been writing extensively about modern SaaS and software engineering practices, including cloud infrastructure, product analytics, and data engineering, to help developers, product managers, and founders build better products and engineering organizations. Jeevesh’s technical writings aim to educate the audience about the principles of SaaS unit economics, reducing customer churn, database design, full-stack development, and other technical subjects relevant to SaaS and web application development.