
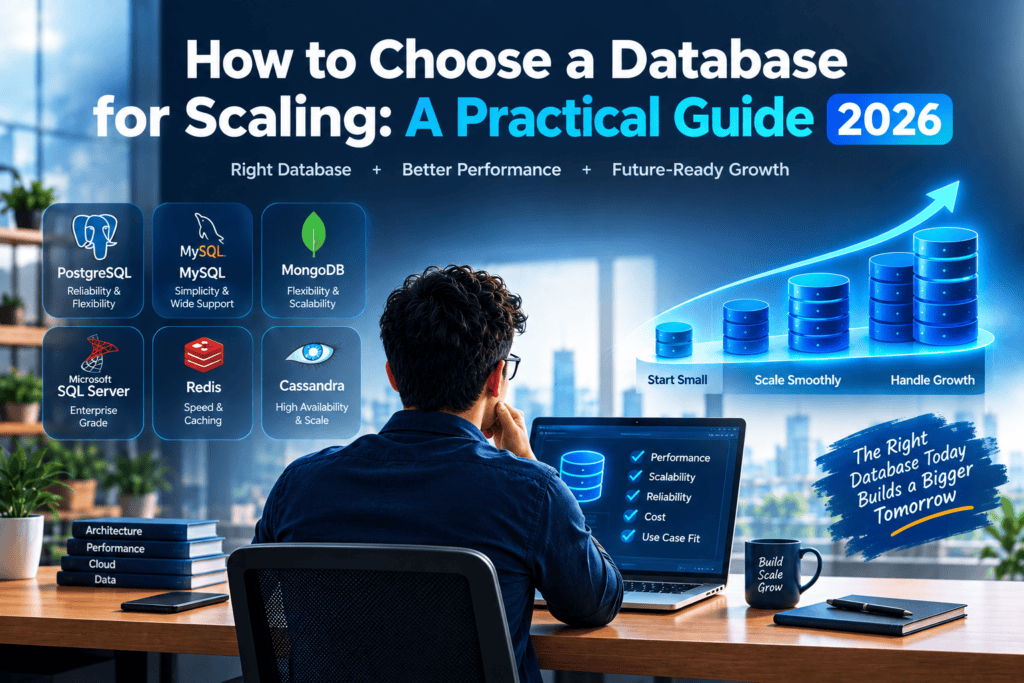
Table of Contents
Introduction to Relational Database Scaling for SaaS
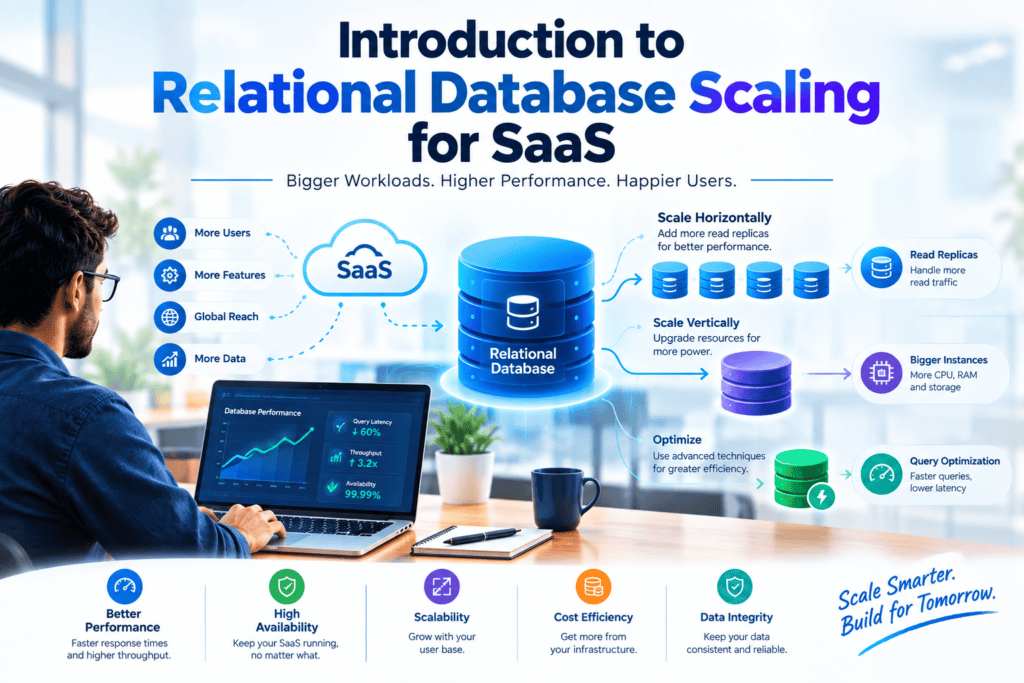
As a SaaS application grows and acquires more users, tenants, transactions, and queries, its relational database needs to scale to maintain performance. Databases are essential to any application, and failures within them can lead to slow performance, thus affecting the user experience of all tenants in the SaaS application.
Therefore, it is crucial for teams to evaluate the importance of database performance optimization at a multi-tenant SaaS because the workload generated by a single tenant can create adverse performance effects on other co-tenants.
Teams should consider scaling up relational databases when there is a steady increase in CPU, memory, storage, connections, or query delays approaching their maximum utilization levels.
However, databases have to be scaled out strategically because adding more resources to a system that has reached its capacity plateau will not solve the performance problem.
For instance, if an application’s database has inefficient queries and lacks indexing, it might be necessary to optimize the schema or rethink the system’s design before proceeding with the data model.
SaaS Database Partitioning Models: Silo, Bridge, and Pool
When developing a multi-tenant SaaS solution there are a number of decisions that have to be made about how to store and process data specific to a particular tenant. These decisions can have an enormous impact on the potential for cross-tenant information leakage, cost and complexity of development and deployment, and overall system’s security and scalability. The three most common approaches are Silo, Bridge, and Pool. Let’s describe each of them in more detail.
Silo Model
In the silo model, each customer has their own dedicated database (or, potentially, their own dedicated DB server/instance). There is no shared storage layer between customers.
How it works: when a new customer signs up, you provision a new database instance for them, and your application routes queries to the relevant instance based on the customer (typically identified by the logged-in user or subdomain).
Pros:
- Strongest isolation. Tenants’ data is physically isolated from each other, which simplifies compliance with regulatory requirements such as HIPAA, GDPR, and data residency regulations.
- Easier to provide a complete export of the data for a particular tenant or delete it.
- A performance degradation or noisy neighbor problem that occurs in one tenant’s database does not affect other tenants.
- Tenants can be individually backed up, scaled, or customized.
Cons:
- High cost to operate at scale due to hundreds or thousands of databases
- Schema migrations are operations that need to be run on every single database, which can become very tedious
- Underutilized resources for small tenants since each tenant’s data is housed in its own database, where a 1% utilization of capacity costs as much as 100% utilization
Best fit for: Enterprise SaaS with big customers that demand or need isolation (compliance reasons) or that want to bill those customers a premium for isolation.
Bridge Model
The bridge model (sometimes referred to as “hybrid”) is positioned between the silo and the pool options. The tenants share the same database server but have their own schema (logical namespace).
In this case, the database server accommodates several schemas (one for each tenant). Each of them contains the same set of tables (customers, orders) but these tables are independent because they are stored in different schemas.
Pros:
- Better than silo in terms of resource utilization because compute is shared across tenants
- Still provides reasonable isolation (cannot accidentally query another tenant’s tables)
- Backup/restore or migration for a single tenant is possible but not as straightforward as with silo
- Scaling is easier because groups of tenants can be spread across multiple servers
Cons:
- Schema-per-tenant still involves running migrations N times (once per schema)
- Many databases have practical limits on the number of schemas/connections per instance
- More complex connection pooling and routing logic than a pure pool model
Best for: Mid-market SaaS looking to balance cost efficiency with a need for reasonable data separation
Pool Model
In the pool model all tenans share the same database and the same schema. The tenant data is stored in common tables associated with a tenant_id (or organization_id) column
How it works: every table has a column with the tenant identifier and all queries have a WHERE tenant_id = ? filter either explicitly in the application code or implicitly enforced by row-level security (RLS) policies.
Pros:
- Most cost-effective and uses resources efficiently model: single schema, single set of migrations, shared connection pools
- Easiest to manage and scale horizontally (sharding by tenant_id range or hash)
- Fastest to develop features that are useful across all tenants, as there is only one schema to manage
Cons:
- Weakest isolation – if there is a bug that prevents filtering by tenant_id, it leads to information leakage between tenants, which is a severe security issue
- “Noisy neighbor” problem – one tenant can consume more resources than allowed, degrading the performance of all the other tenants
- Difficult to provide customization, per-tenant support, backups, or data export/deletion
- Compliance-sensitive customers will not accept it
Best for: High-volume, self-serve SaaS with many small tenants (think: startups, SMB-focused tools) where cost efficiency and speed of iteration matter most.
Choosing a Partitioning Approach
There’s no universal “best” model — the right choice depends on your product’s shape and customer base. A few questions to guide the decision:
- Who are your customers? Enterprise customers who are concerned about compliance often require silo-level isolation. SMB/prosumer customers are often indifferent and/or unaware, which makes pool more compelling.
- What is your expected number of tenants and growth trajectory? Silo does not scale well beyond a few hundred tenants due to massive increases in operational overhead. At that point, pool can scale to tens of thousands with significantly reduced overhead.
- How sensitive is the data? For healthcare, finance SAAS, and government-related applications, a breach can be catastrophic, and therefore, the data classification is often a deciding factor.
- What is your engineering capacity? Bridge and pool are much easier to build and maintain with a limited engineering team. The automation required for provisioning, migrations, and monitoring in silo can be prohibitively resource-intensive if you do not have the headcount.
- Do you need to provide customization and/or SLAs per tenant? If you have enterprise customers that require a certain level of performance and/or customized schema extensions, it is significantly easier to support them in silo (or bridge).
A common real world pattern is that SaaS companies often have a tier approach, where they use a pool model for free/self-serve tenants, and a silo (or dedicated bridge schema) for enterprise customers who need isolation and are willing to pay for it. This allows to optimize for cost in the low end, and trust/compliance for the high end.
Common Relational Database Scaling Strategies
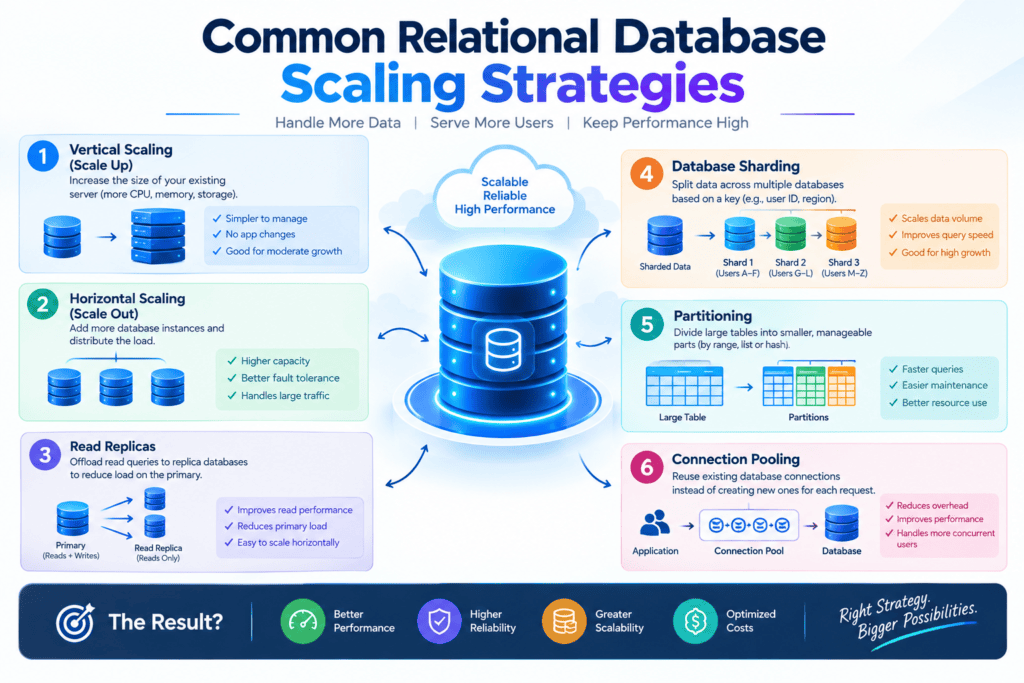
As databases grow and scale, relational database systems (RDBMS) like MySQL, PostgreSQL, and SQL Server can often become the largest bottleneck. Because RDBMS often require ACID guarantees and complicated interrelations between sets of data, optimizing and scaling these databases must be multi-faceted.
The three key methods of database optimization and scaling are scaling your physical resources, optimizing operations, and changing your architecture.
1. Scaling Physical Resources (Hardware & Infrastructure)
This is typically your first line of defense when performance starts to dip. Before refactoring code or re-architecting systems, adding or upgrading hardware provides immediate relief.
Vertical Scaling (Scale-Up)
Vertical scaling means upgrading the capacity of your existing database server by adding more physical resources.
- CPU: The bigger the cores count and the higher is the frequency of each core, the faster will be the query execution, especially for complex queries analyzing large amounts of data and joining multiple datasets, as well as for increased concurrent user connection.
- RAM: The more RAM is added to the system, the more data and indexes can be stored in a RAM cache (named buffer pool for MySQL), which significantly reduces disk I/O operations.
- Storage speed: Upgrading from traditional SSD to newer NVMe standard will provide higher input-output operations per second (IOPS) and lower latency for disk reads and writes.
- Pros: No code or schema changes are required for scaling in all three layers. Increased capacity is available right away.
- Cons: Physical hardware limitations are often hit at certain capacity levels, and costs tend to increase exponentially with capacity. Also, there is a single point of failure for each layer.
Read Replicas (Scale-Out for Reads)
For read-heavy workloads (like social feeds, e-commerce browsing, or reporting dashboards), you can offload traffic from the primary database by creating read-only replicas using asynchronous replication.
- Primary (Writer): all write operations (INSERT, UPDATE, DELETE).
- Replicas (Readers): replicate data from the primary and process all incoming SELECT queries.
- Trade-off (Replication Lag): since replication is usually asynchronous, there is a slight delay before a write on the primary is reflected on a replica, causing eventual consistency issues (e.g., a user updates their profile but does not see the changes reflected, until they refresh the page).
2. Optimizing Database Operations (Software & Query Level)
Adding hardware can be expensive and inefficient if your database is poorly tuned. Optimizing how your database processes data extracts maximum performance from existing infrastructure.
Query and Index Optimization
- Indexes: Make sure that all columns which participate in WHERE, JOIN, ORDER BY and GROUP BY conditions are indexed. Create composite indexes for queries which reference several columns. However, avoid creating too many indexes since all updates and inserts require additional workloads to maintain the indexes.
- Refactor queries: Try to remove unneeded columns from SELECT statements to reduce the amount of data transferred. Use batched operations or joins instead of making N+1 queries which is a common source of performance issues.
- Analyze query execution plans: Use EXPLAIN ANALYZE command (PostgreSQL/MySQL) or similar utilities which allow to see if a query performs full table scans, uses incorrect JOIN algorithms or temporary disk storage.
Connection Pooling
The opening and closing of database connections for each HTTP request is expensive. A connection pooler (PgBouncer for Postgresql or HikariCP for Java) maintains a warm pool of available connections and decreases the cpu overhead and connection exhaustion for high traffic.
Database Caching
Offload redundant database reads by placing an in-memory cache (such as Redis or Memcached) in front of the RDBMS.
- Cache-Aside Pattern: First check in the cache, if the required information is present (hit), then return that information. If the information is not present (miss), query the database, update the cache with the newly retrieved information, and then return the information.
- Best used for: Information which is read frequently but rarely updated (like user profiles).
Database Engine Tuning
Adjust configuration parameters to match your server’s hardware capacity:
- Increase buffer pool/cache size (e.g.,
innodb_buffer_pool_sizein MySQL orshared_buffersin Postgres). - Fine-tune max connection limits, checkpoint intervals, and write-ahead log (WAL) parameters to balance durability and throughput.
3. Changing Database Architecture (Structural & Data Model Redesign)
When a single node cannot handle the write volume or data size even with hardware upgrades, you must fundamentally change how data is organized and distributed.
Functional Partitioning (Database Splitting)
Separate data by domain or service into distinct physical databases.
- Example: Instead of having one giant DB that contains all data, separate it into an Auth DB, a Payments DB and an Inventory DB
- Impact: While this decreases cross-table locks and consequent isolations failures, it makes cross-domain JOIN impossible
Table Partitioning (Horizontal / Vertical)
Inside a single database instance, you can break large tables into smaller chunks.
- Vertical Partitioning means to split the columns of a table into different tables. This is useful for wide tables that contain some columns that are accessed rarely to reduce the amount of data that needs to be processed and stored (e.g., BLOB fields, JSON fields, or long textual descriptions).
- On the other hand, Horizontal Partitioning (Range, List, or Hash) means to split the rows of a table according to their keys (e.g., year or region). The database engine then routes the queries to the corresponding partitions, thus reducing the number of rows to be searched and indexed.
Sharding (Horizontal Scaling across Nodes)
Sharding distributes rows of a table across multiple distinct database servers based on a shard key (e.g., user_id % 4).
- Pros: Unlimited horizontal write and read scalability.
- Cons: Extremely complex to implement and maintain. Cross-shard queries, joins, and transactions become very slow or impossible without distributed transaction protocols.
Moving Non-Relational Workloads (Polyglot Persistence)
Not all data belongs in an RDBMS. Offloading specific access patterns to specialized databases lightens the relational load:
- Time-Series Data: Logs, metrics, and IoT streams $\rightarrow$ TimescaleDB, InfluxDB.
- Full-Text Search: Complex text queries $\rightarrow$ Elasticsearch, OpenSearch.
- Unstructured/Document Data: High-volume flexible schemas $\rightarrow$ MongoDB, DynamoDB.
Summary Matrix
| Strategy | Scaling Dimension | Target Problem | Complexity | Cost |
| Vertical Scaling | Compute / Memory | High overall CPU/RAM usage | Low | High (at scale) |
| Read Replicas | Read Throughput | High read-to-write ratio | Low–Medium | Medium |
| Query & Index Tuning | Efficiency | Slow queries, high CPU spikes | Low | Very Low |
| Caching (Redis) | Read Throughput | Repetitive database reads | Medium | Low–Medium |
| Sharding | Write Throughput & Storage | Monolithic table too large for one server | Very High | High |
Vertical Database Scaling
Vertical database scaling, or scaling up, is a strategy that involves expanding or enhancing a database server’s resources instead of adding more database servers. It is often the case that this includes improving CPU, memory, storage performance, and network capabilities. I think that for SaaS applications, it can be a good choice to scale vertically at least initially if the database traffic, queries, or users start to exceed the current database’s capacity.
Increasing CPU, Memory, and Network Resources
A database can be scaled up by adding more CPU cores to process queries faster, adding more RAM to cache frequently accessed data, and upgrading storage or network infrastructure to perform data read/write operations faster. Upgrading memory can reduce the need for disks, and additional CPU capacity helps process more complex queries and increases concurrency.
Benefits and Limitations
The first advantage of a vertical scaling strategy is its simplicity. It allows the DBA to scale the database without the overhead of database sharding or partitioning and the complexity of managing many database servers. In some cases, it avoids the need to make changes at the application level to support distributed databases, since the database layer architecture remains the same.
The disadvantages of a vertical scaling strategy are limitations in physical hardware and expenses; very large database instances can be extremely costly and have limited headroom for growth. In addition, it often requires server reboots or downtime to add resources, depending on the database platform and infrastructure.
Vertical Scaling for Multi-Tenant SaaS
For multi-tenant SaaS applications, vertical scaling is useful when there are many tenants on the same database with increased overall load. The database server upgrade will give extra headroom without changing the overall architecture of the tenancy structure right away. However, SaaS management teams must keep an eye on the usage, performance, connection, and resource consumption of individual tenants to identify loads that may soon overwhelm the system and impact other customers’ performance. For more information on database scaling patterns for SaaS applications, see this AWS guide on scaling relational databases for SaaS.
Managing Noisy-Neighbor Risks
A noisy neighbor syndrome is a scenario where one tenant consumes more than their fair share of resources, thus negatively impacting the performance of other tenants. Although vertical scaling can resolve the issue, it does not address the root cause.
To avoid noisy neighbors in a multi-tenant SaaS application, it is recommended to scale databases while also considering resource monitoring, query optimization, connection pooling, rate limiting, workload isolation, and tenant-level limits.
The problem can be resolved by moving to dedicated databases if some tenants are particularly resource-intensive.
In general, I think that vertical scaling is a great option to start with, but it is important to carefully evaluate costs and performance trade-offs in order to scale the database both vertically and horizontally.
Horizontal Scaling with Read Replicas
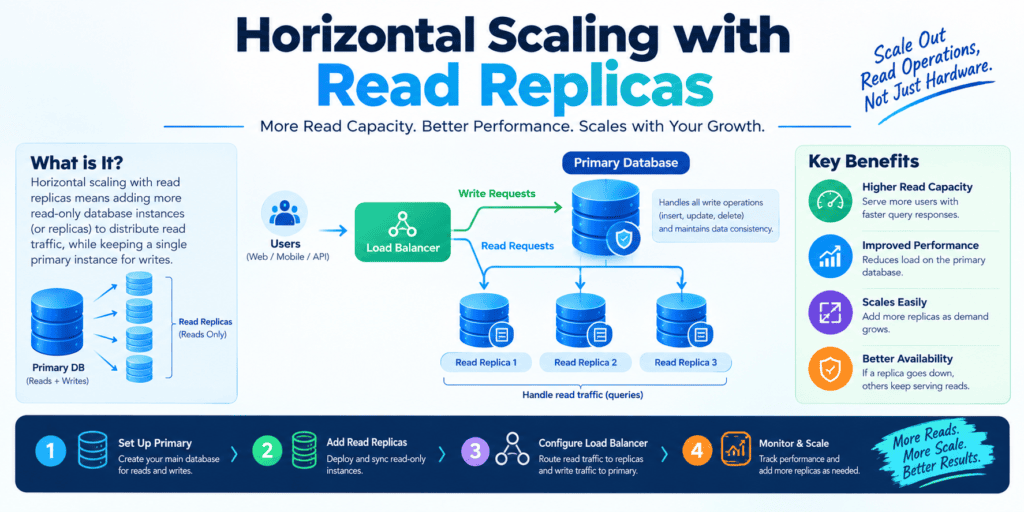
Replica sets allow horizontal scaling of a relational database (PostgreSQL, MySQL, Amazon RDS, etc.) by distributing read operations among different nodes.
In other words, you can scale your database not by upgrading the size of your existing database (vertical scaling), but by adding new nodes that will handle your database reads.
I prepared a brief overview and some frequently asked questions about read replicas. Let’s dive in.
What are read replicas? Why are they useful? How are they different from standby instances? And how can I scale my database with read replicas?
What Are Read Replicas?
A read replica is a read-only copy of your primary database. The primary handles all writes (INSERT, UPDATE, DELETE), while replicas receive queries (SELECT).
Data is constantly replicated from the primary to replicas in either asynchronous or synchronous manner.
                         ┌──────────────┐
                  ┌─────>│ Read Replica │ (Read Only)
                  │      └──────────────┘
┌──────────────┐  │      ┌──────────────┐
│ App Servers  ├──┼─────>│ Primary DB   │ (Read / Write)
└──────────────┘  │      └──────────────┘
                  │      ┌──────────────┐
                  └─────>│ Read Replica │ (Read Only)
                         └──────────────┘
When to Use Read Replicas
Read replicas are ideal when your database system experiences specific operational bottlenecks:
- High read-to-write ratio: Your application is dominated by queries, for example, because it is a content platform or e-commerce store with a 10:1 or 100:1 or higher read-to-write ratio.
- Primary database CPU or I/O bottlenecks: Your primary database is hitting CPU or I/O limits due to heavy querying, not write transactions.
- Heavy reporting or analytics: You need to run long, heavy queries or ETL processes that should not block or negatively impact the performance of the main application.
- Geographic distribution: You need to serve data to users in different geographic locations with low latency.
- Separation of concerns: You need to decouple background jobs, pipelines, or search from your main database.
Improving Read Performance
Offloading reads to replicas boosts performance across your entire data layer in three key ways:
1. Load Distribution
By pointing application read queries to replica endpoints, the primary database is freed up to dedicate its CPU, memory, and disk I/O exclusively to handling writes and critical transactions.
2. Microsecond-Level Read Routing
Using database connection pools, ORM configurations, or proxy tools (like ProxySQL, PgBouncer, or AWS RDS Proxy), application traffic is automatically routed:
- Writes go to
primary.db.internal - Reads are load-balanced across
replica-1.db.internal,replica-2.db.internal, etc.
3. Reduced Query Lock Contention
Read queries on the primary database can lead to lock contention, slowing down write operations. Running read-heavy workloads on replicas prevents read locks from blocking critical database writes.
Important Consideration: Replication Lag
Because replication is asynchronous by default, there is always some lag — the time it takes for a change to appear on replicas after it has been committed on the primary. For applications that require immediate visibility of writes (like profile edits), the application should route each user’s own reads back to the primary for a short time.
Availability and Operational Benefits
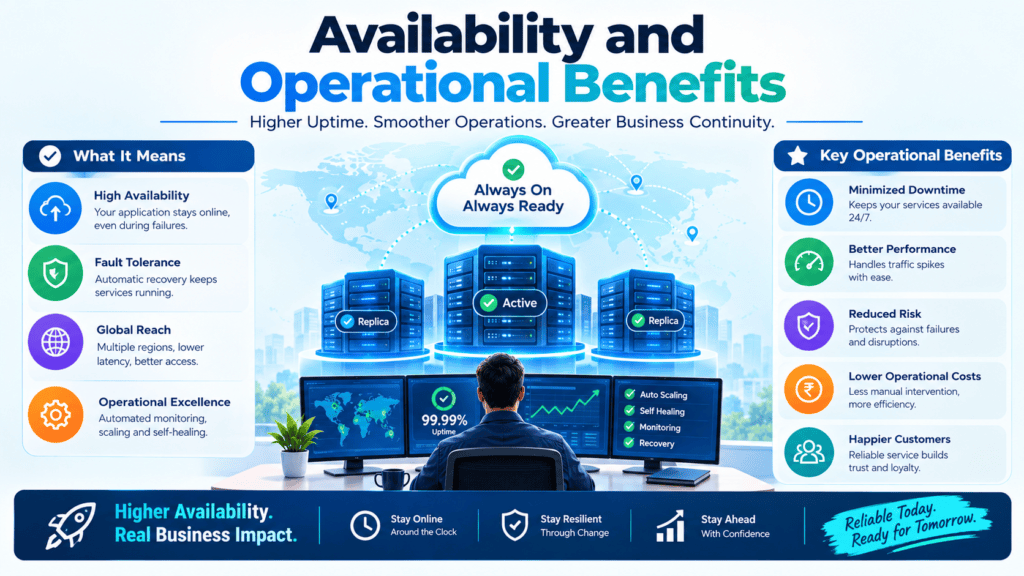
Beyond raw performance, read replicas significantly improve system resilience and maintenance workflows.
| Benefit | Description |
| High Availability & Failover | If the primary database fails, a read replica can be promoted to become the new primary, minimizing downtime. |
| Geographic Read Scaling | Replicas placed in different cloud regions bring data closer to global users, reducing latency. |
| Zero-Downtime Maintenance | OS patches, minor database upgrades, and index creations can be performed on replicas sequentially without affecting primary traffic. |
| Isolated Analytics & Backups | Non-time-sensitive tasks—such as generating nightly reports, running backups, or exporting data—can be run against a replica with zero impact on production users. |
Automatic Replica Scaling
Modern managed database platforms (such as Amazon Aurora, Google Cloud SQL, Azure Database, and CockroachDB) support auto-scaling read replicas based on real-time traffic demand.
How Auto-Scaling Works
- Metrics monitoring: CPU utilization, read IOPS, or replication lag of the replica set.
- Dynamic scale-out: Launches new read replicas if the average CPU utilization reaches a given threshold (e.g., 70%).
- Dynamic scale-in: If the traffic demand decreases, the system terminates the extra replicas to save resources.
- Automatic endpoint management: The application connects to an abstract reader endpoint (DNS). This DNS distributes the incoming traffic to the replicas and allows scaling within seconds after replica creation or termination, without any application code changes.
Auto-Scaling Best Practices
- Use the minimum and maximum replica values to control costs.
- Use appropriate cooldowns to avoid excessive scaling up and down (flapping).
- Watch out for replication lag – if replicas are falling behind, adding more replicas can actually add to the replication lag on your primary.
Optimizing the Existing Database Architecture
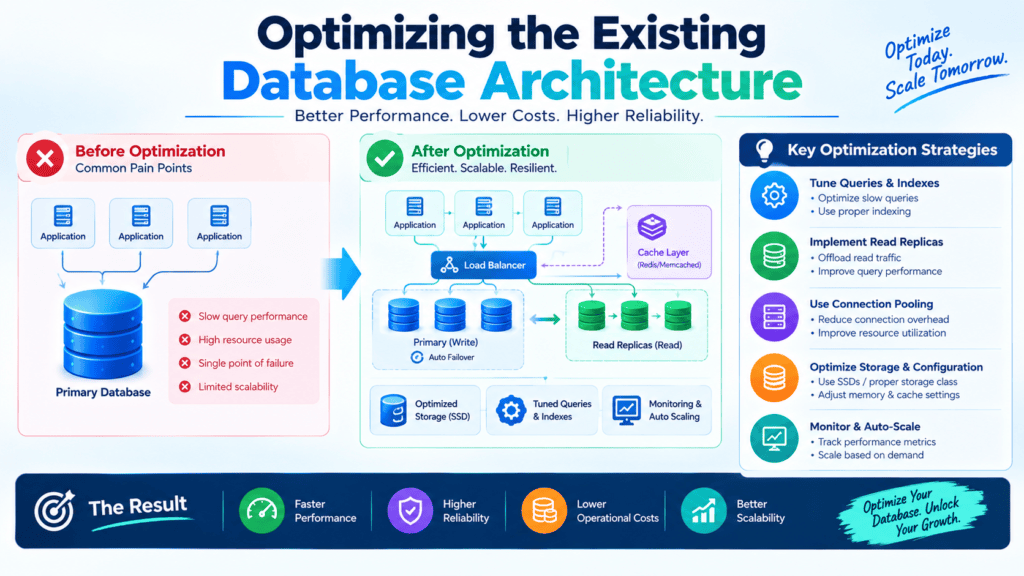
As applications grow, databases are often the first bottleneck to hit. Instead of immediately going to a full re-architecture or expensive hardware upgrades, there’s usually room for optimization in the way that the application communicates with the database. Three particularly useful methods for addressing this issue are micro-batching, reducing overhead, and offloading work onto queues for asynchronous processing.
1. Micro-Batching
Most apps are written to process one row at a time: insert a row, update a row, select a row. This is natural to think about from a programming point of view, but it’s hugely wasteful: every single one of these operations has to pay the cost of a round trip, connection setup, query parsing and so on.
Micro-batching is a technique that reduces the number of these database operations by grouping related operations into batches and sending them to the database at once. Instead of issuing 1,000 individual INSERT queries, you accumulate records for a period of time (50-200 ms by default, or until a certain number of records have been accumulated, such as 500) and perform a single bulk INSERT that inserts all of them.
Why it works:
- A single batched query amortizes the cost of some operations (network round trip, query planning, lock acquisition) over many rows, rather than paying per-row.
- Databases tend to be much more efficient at writing/reading a bulk of records in one pass than many individual transactions.
- It reduces contention on shared resources, such as connection pools and lock managers.
Practical considerations:
- Choose a batching window that is not too small (to avoid not getting any benefit from batching) and not too large (to avoid latency for time-sensitive operations).
- Implement a hybrid trigger that initiates the batch once either the size or the deadline has been reached.
- Make sure that partial failures are handled correctly, and the system does not silently discard the whole batch of records upon a single bad record.
2. Reducing Database Request Overhead
Even before batching, there’s often low-hanging fruit in simply reducing the number and cost of requests hitting the database:
- Connection pooling: Opening and closing of database connections is expensive. A well-tuned connection pool keeps live connections around and reuses them instead of opening and closing connections for every request.
- Prepared statements/query plan caching: Queries which are repeated with different parameters should use prepared statements so that the database can reuse the execution plan instead of parsing and optimizing the query for every call.
- Caching reads: Commonly read data which doesn’t change often (user profile data, configuration data, lookup tables) should be cached in some sort of memory cache like Redis or Memcached, eliminating the need to read it from the database at all.
- Selective querying: Only select the columns which are needed (avoid SELECT ), make sure to add indexes to columns in WHERE clauses, and avoid N+1 query problems in order to reduce I/O and CPU usage on the database.
- Combining round trips: Whenever possible, combine sequential round trips to the database into a single query by using something like JOINs, IN clauses, or stored procedures instead of letting the application layer do it.
The underlying principle is the same throughout: every round trip to the database has a fixed cost, so the goal is to make each trip count for more.
3. Using Queues and Asynchronous Processing
Not all database writes need to be synchronous. A lot of operations can be safely processed later, without interrupting the user. For example, you can defer sending notifications, analytics events, updating secondary databases or generating reports.
By introducing a message queue (RabbitMQ, Kafka, SQS) between the application and the database you loose coupling between processing a request and committing changes to the database:
- The application gets a request and stuffs a tiny note in a queue.
- Then it turns around and tells the user what it did, without having to wait for the database to finish writing.
- Meanwhile, another process is polling the queue, probably in batches (again, micro-batching!) and doing the actual database writes.
Benefits:
- Improved responsiveness: The user initiated request completes faster as it is not waiting in a database IO.
- Load smoothing: The spikes in traffic are smoothed by the queue and the workers process it at a slower more controlled rate that the database can handle.
- Resiliency: If the database is slow or down, the worker processes just wait in the queue instead of failing.
- Natural batching point: Workers that read from a queue naturally batch up messages before writing them out to the database, this can be combined with micro-batching techniques
Trade-offs to plan for:
- Eventual consistency is when changes are not immediately reflected in a database, which means downstream systems should be able to tolerate some delay.
- Additional infrastructure and operational overhead (queue monitoring, dead-letter processing, retries)
- Idempotency is important since workers may retry messages, which means writes should be able to tolerate being performed more than once.
Bringing It Together
These three techniques compound well:
- Reduce overhead at the query level so that each database interaction is as cheap as possible.
- Batch those interactions to spread out fixed costs over many records rather than a single one.
- Queue and process asynchronously so that the database only receives work at a pace and shape it can handle efficiently, decoupled from the user-facing latency.
None of this requires ripping out the existing database or migrating to a new architecture, it’s about being more deliberate about how the application interacts with the database it has. The latter for most systems will allow deferring a much larger, more disruptive, scaling effort by a significant margin.
Want me to turn this into a downloadable file (Markdown or Word doc) for your blog CMS, or add diagrams/code examples for any of the sections?
Database Table Partitioning
Database table partitioning is one of the most potent techniques for managing large-scale, enterprise applications. Large tables, which contain millions or even billions of rows, begin to show their teeth in terms of simple query performance, bloating indexes, and causing index rebuilds or backups to become long-running operations.
Table partitioning helps to alleviate these issues by splitting one monolithic structure into smaller physical pieces that are easier to maintain while presenting a single logical view to the application code.
This article describes how table partitioning works, how it can be implemented with an example of using a tenant ID, the benefits that it brings to multi-tenant SaaS applications, and the potential pitfalls that may be encountered.
1. How Table Partitioning Works
At its simplest, table partitioning is a process of breaking down one large logical table into smaller physical tables also referred to as partitions.
From an end-user’s perspective, a partitioned table is identical to the original database table (SELECT * FROM orders). However, at a lower level, the database management system (DBMS), be it PostgreSQL, MySQL, SQL Server, or Oracle, routes incoming rows to different storage files based on a specified Partition Key and Partitioning Strategy.
                        +----------------------------+
                        |     Logical Table: orders  |
                        +----------------------------+
                                      |
                       [ Partition Key: tenant_id ]
                                      |
         +----------------------------+----------------------------+
         |                            |                            |
         v                            v                            v
+------------------+         +------------------+         +------------------+
| Partition: P1    |         | Partition: P2    |         | Partition: P3    |
| (tenant_id = 101)|         | (tenant_id = 102)|         | (tenant_id = 103)|
+------------------+         +------------------+         +------------------+
Common Partitioning Strategies
- List Partitioning: Rows are assigned to partitions based on explicit lists of key values (e. g. partitioning by country_code or specific tenant_ids).
- Hash Partitioning: The database applies an internal hash function to the partition key (e. g. hash(tenant_id) % total_partitions) to evenly distribute rows across a fixed set of partitions.
- Range Partitioning: Rows are split into ranges based on continuous values (most commonly timestamps, like created_at BETWEEN ‘2026-01-01’ AND ‘2026-01-31’).
- Composite (Sub-partitioning): A combination of two strategies, such as range-partitioning by date first, and then sub-partitioning each date range by tenant_id.
The Core Mechanism: Partition Pruning
The main performance benefit of table partitioning comes from Partition Pruning. When a query includes the partition key in its WHERE clause:
SQL
SELECT * FROM orders
WHERE tenant_id = 101 AND status = 'COMPLETED';
The database query planner skips over all other partitions and only scans the physical partition that corresponds to tenant_id = 101. This is exponentially faster than a 100 million row table!
2. Partitioning by Tenant ID
In multi-tenancy SaaS applications, all core domain tables (users, orders, invoices, events, etc.) have a tenant_id column to enforce logical separation of data between accounts.
When using tenant_id as your partition key, there are typically two primary approaches you can take:
Approach A: List Partitioning (Dedicated Tenant Partitions)
In this model, high-value or large enterprise tenants get their own dedicated partition, while smaller tenants share a single “catch-all” default partition.
- Database Engine Example (PostgreSQL):
SQL-- Root table CREATE TABLE orders ( order_id UUID NOT NULL, tenant_id INT NOT NULL, amount DECIMAL(10,2), created_at TIMESTAMP, PRIMARY KEY (tenant_id, order_id) ) PARTITION BY LIST (tenant_id); -- Dedicated partitions for enterprise tenants CREATE TABLE orders_tenant_101 PARTITION OF orders FOR VALUES IN (101); CREATE TABLE orders_tenant_102 PARTITION OF orders FOR VALUES IN (102); -- Catch-all partition for smaller self-serve tenants CREATE TABLE orders_default PARTITION OF orders DEFAULT;
Approach B: Hash Partitioning (Uniform Distribution)
If you have lots and lots of small-to-mid size tenants and no desire to scale up thousands of tables, Hash Partitioning will spread your data among a reasonable number of physical partitions (64 or 128, for example).
SQL
CREATE TABLE orders (
    order_id UUID NOT NULL,
    tenant_id INT NOT NULL,
    amount DECIMAL(10,2),
    PRIMARY KEY (tenant_id, order_id)
) PARTITION BY HASH (tenant_id);

-- Create 4 hash partitions
CREATE TABLE orders_p0 PARTITION OF orders FOR VALUES WITH (MODULUS 4, REMAINDER 0);
CREATE TABLE orders_p1 PARTITION OF orders FOR VALUES WITH (MODULUS 4, REMAINDER 1);
CREATE TABLE orders_p2 PARTITION OF orders FOR VALUES WITH (MODULUS 4, REMAINDER 2);
CREATE TABLE orders_p3 PARTITION OF orders FOR VALUES WITH (MODULUS 4, REMAINDER 3);
3. Benefits for Multi-Tenant Databases
Partitioning by tenant_id offers distinct advantages for SaaS platforms handling large data sets:
| Benefit | Description |
| Improved Query Performance | By enabling Partition Pruning, queries filtering on tenant_id only touch index trees and data pages for that specific tenant, leading to faster execution times. |
| Strict Data Isolation | Physical separation lowers the risk of accidental cross-tenant data leaks at the disk level, making it easier to meet strict enterprise compliance standards. |
| Fast Tenant Offboarding & Deletion | Deleting an order table for a big enterprise tenant (DELETE FROM orders WHERE tenant_id = 101) will lock tables and create massive I/O overhead. Using list partitioning, you can simply drop a partition (DROP TABLE orders_tenant_101;) and it will happen in virtually no time at all. |
| Targeted Maintenance | Database tasks like VACUUM (PostgreSQL), OPTIMIZE TABLE (MySQL), or index defragmentation can be executed on individual tenant partitions off-peak without locking the entire system. |
| Tiered Storage Optimization | Dedicated partitions for enterprise clients can be stored on ultra-fast NVMe SSDs, while low-tier or dormant tenant data can be moved to cheaper storage tiers. |
4. Partition Hot Spots and Operational Challenges
While partitioning solves severe scale issues, it is not a silver bullet. Incorrect implementation introduces new failure modes and administrative overhead.
       UNBALANCED HASH / LIST PARTITIONING
+-------------------------------------------------+
|  Partition 1 (Tenant A - Enterprise)           | ---> 92% Disk / CPU Usage (HOT SPOT)
|  [||||||||||||||||||||||||||||||||||||||||||||] |
+-------------------------------------------------+
|  Partition 2 (Tenants B, C, D)                  | ---> 5% Disk Usage
|  [|||]                                          |
+-------------------------------------------------+
|  Partition 3 (Tenants E, F, G)                  | ---> 3% Disk Usage
|  [||]                                           |
+-------------------------------------------------+
A. The “Noisy Neighbor” & Partition Hot Spots
- The Problem: Tenants in a SaaS environment exhibit a power-law distribution for data size, and 1% of enterprise customers often make up 80% of the overall data volume.
- The Impact: If Hash Partitioning assigns one massive enterprise tenant and 50 small but active tenants to the same hash bucket by accident, then that specific partition is going to have I/O wait time issues and CPU contention. Any other tenant on this physical partition would experience significant degradation in performance due to the “noisy neighbor”.
B. Global Unique Keys and Primary Key Constraints
Most relational database engines require that the partition key MUST be part of every unique constraint and Primary Key on the table.
- The Challenge: The primary key on order_id will become invalid over a partitioned table, so you need to change it to a composite key. PRIMARY KEY (tenant_id, order_id).
- The Trade-off: Enforcing uniqueness across partitions for any key that is not a partition key is hard or impossible to do (e.g. have a unique user_email across all tenants without scanning all the partitions).
C. Cross-Partition Queries
Queries that do not include the tenant_id in their WHERE clause cannot leverage partition pruning.
SQL
-- DANGER: Triggers a scan across EVERY partition (Scatter-Gather Query)
SELECT * FROM orders WHERE order_id = 'a3b1c2-89ef...';
The database engine must route this query to every individual partition, assemble the results, and merge them back together. This causes heavy CPU usage and severe latency spikes.
D. Partition Proliferation & Schema Migration Overhead
If you create a separate partition for every tenant and scale to 50,000 tenants, your database will need to manage hundreds of thousands of physical tables (50,000 tenants × 10 core domain tables).
- Memory Pressure: The database engine needs to cache file descriptors, metadata, and cache structures for tens of thousands of individual tables in memory.
- Migration Hell: Performing DDL schema migrations (ALTER TABLE orders ADD COLUMN status_v2 VARCHAR(50);) across tens of thousands of physical child partitions can cause metadata registry locks and outages during deployments.
Summary Best Practices
- Include tenant_id early: Make sure to include the tenant_id in all composite primary keys of major tables right away
- Combine Range + Hash/List Partitioning: For long-term historical data, consider composite partitioning, with Range partitioning on Date and sub-partitions for each tenant_id List or Hash.
- Isolate Whales: Isolate large enterprise clients in their own list partitions, directing normal multi-tenant flow into hash partitions.
- Enforce Query Discipline: Use query linters and ORM constraints to always include the partition key in database queries, avoiding scatter-gather execution plans
Aggregating and Pre-Computing Data
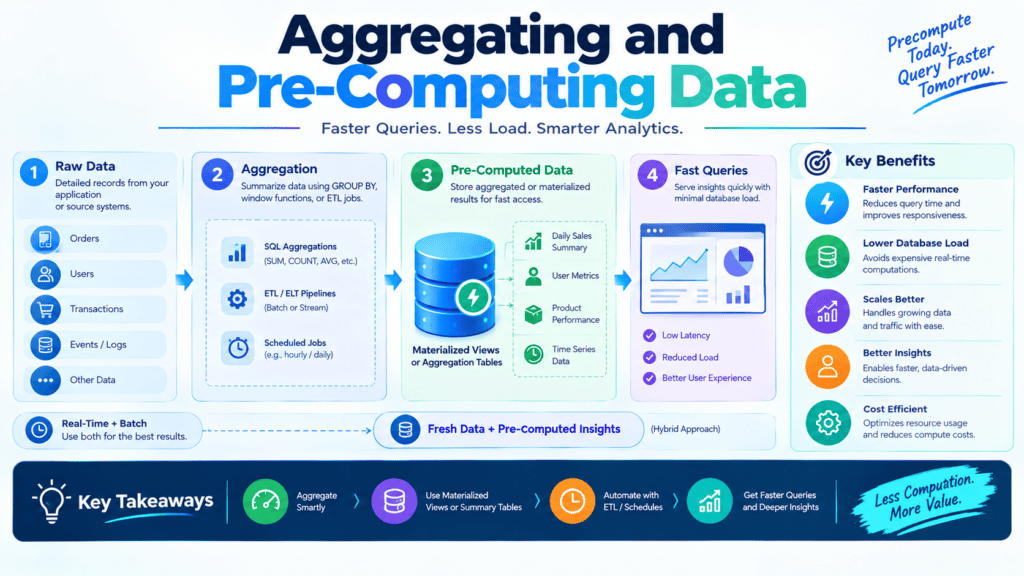
A possible solution to address the above challenge is to decouple the database layer which hosts the transactional data from analytical queries. For instance, databases usually handle two kinds of workloads — Online Transaction Processing (OLTP) and Online Analytical Processing (OLAP). The former is for day-to-day operations such as creating new orders, managing users, or accepting payments. The latter involves performing analytics on these databases.
In SaaS, there are two broad cases for analytics – per-tenant analytics and cross-tenant analytics. For the first category, analytics queries can be moved to pre-aggregated data about each customer (e.g., daily sales or active users). In the second case, companies might need to query across tenants, possibly with PII (Personally Identifiable Information), hence requiring additional care. An option here is to build aggregated datasets across tenants that can be queried for analytical purposes.
Aggregation can be a good way to accelerate analytical queries, especially for dashboards and reports that display some form of summary data. A common pattern is to have materialized views which can be refreshed periodically or on-demand, rather than calculating the values every time a user tries to access the dashboard. This reduces the pressure on the production database and speeds up the query process.
Another approach is to utilize read replicas, which allows offloading reading queries while the primary node handles writes. If the analytical needs are very high, then it might make sense to extract the data in the form of replicas or data warehouses to support large-scale reporting and analytics needs.
Scaling Database Connectivity
As apps grow, one of the most common, and misunderstood, bottlenecks are not compute or even query performance, but the database itself, namely connections. This article covers the reasons why connection scaling matters, and how to address it correctly.
The Problem: Database Connection Limits
Every relational database (PostgreSQL, MySQL, SQL Server, Oracle) enforces a hard limit on how many concurrent connections it can accept. For example:
- PostgreSQL by default has around 100 connections (can be configured, but each connection takes a toll on the real memory, often 5-10 MB).
- MySQL by default has 151 connections.
- Managed services like Amazon RDS have scalable limits based on the instance size (a db.t3.micro may only support ~66 connections, while a large instance can support thousands of connections).
Each open connection consumes memory, CPU, and file descriptors on the database server (even when idle).
As your app scales (more app servers, more containers, more Lambda invocations), each instance will open its own pool of connections. It’s easy to reach the database’s connection limit.
Errors you might encounter:
Connection pool exhausted errors.
Timeouts or rejections when trying to establish a new connection.
Queries that hang indefinitely because they’re unable to get access to a connection.
FATAL: remaining connection slots are reserved
too many connections
This is particularly painful in serverless architectures (AWS Lambda, for example) where each function call might establish a new connection to the database. A spike in traffic can lead to thousands of Lambda function invocations and thousands of new database connections attempting to be established at the same time – overwhelming the database in seconds.
Solution 1: Connection Pooling
The first line of defense is connection pooling—reusing a fixed set of already-open connections instead of opening a new one for every request.
Instead of:
Request → Open Connection → Query → Close Connection
Pooling gives you:
Request → Borrow Connection from Pool → Query → Return Connection to Pool
Benefits:
- Reduces the overhead of repeatedly establishing/tearing down TCP and TLS handshakes.
- Caps the number of connections the database sees, regardless of how many app threads are running.
- Improves latency, since connection setup can take tens of milliseconds.
Common tools:
- Application-level pooling: HikariCP (Java), SQLAlchemy pool (Python), pgbouncer client libraries, pg-pool (Node.js) .
- Standalone poolers: PgBouncer and PgCat (PostgreSQL), ProxySQL (MySQL). Both are separate processes/servers, sitting between application instances and database, pooling connections for multiple applications, not just one.
Limitations: application-level pools only allow pooling within a single app instance. If you have 50 microservice replicas with 20-connection pools each, you still need a thousand connections on the database side. Which is where centrally managed pools/proxies come in.
Solution 2: Using Database Proxies
A database proxy is positioned between an application fleet and the database, managing connections on behalf of the former. Instead of every instance of an application connecting directly to the database, they connect to the proxy instead, which opens a much smaller number of connections to the database itself.
Key advantages of proxies:
- Connection multiplexing: allows you to serve thousands of client connections with only a fraction of backend database connections.
- Failover handling: proxies can detect a failover (e.g. in a Multi-AZ setup), and can route traffic accordingly, usually faster than a DNS propagation can happen.
- Security: centralizes database access (like IAM based authentication), rather than having to manage credentials in each service or application that needs to talk to a database.
- Resilience: acts as a buffer for connection surges (traffic bursts) which can spike after deployments or other events.
Popular proxies include PgBouncer, ProxySQL, and cloud-managed options like Amazon RDS Proxy.
Solution 3: RDS Proxy and Connectionless Database Access
Amazon RDS Proxy is a fully managed, highly available database proxy for RDS and Aurora. It is purpose built to solve the problems described above, especially for serverless and highly concurrent workloads.
How it works:
- Your applications (e.g., a Lambda function) connect to an RDS Proxy endpoint, not to a database instance directly
- RDS Proxy maintains a warm standby of actual connections to the database and efficiently multiplexes client requests across them.
- Connections that are idle or unused by your applications do not result in idle connections on the database; they are reused efficiently by RDS Proxy.
Explanation of why it’s beneficial for connectionless access for serverless:
Lambda functions come and go, and without a connection pool, 1000 simultaneous lambdas doing a direct connect to the database would probably exceed the number of allowed connections on the database.
Using RDS proxy, the number of connections attempted from the application would be dissociated from the number of connections actually made to the database itself, giving the appearance of “connectionless” database access from the application.
Additional RDS Proxy features:
- IAM authentication: eliminates the need to manually hardcode or rotate database credentials
- Automatic failover support: reduces failover time for Aurora/RDS Multi-AZ by up to 66% (since RDS Proxy maintains connection state) compared to traditional proxies.
- TLS enforcement: can enforce TLS encryption of connections from clients to the proxy.
- No application code changes: typically only require changing the application’s connection endpoint; minimal code changes may be required.
Putting It Together: A Scaling Strategy
| Layer | Purpose | When to Use |
|---|---|---|
| App-level pooling (HikariCP, SQLAlchemy) | Reduce connection churn per instance | Always, as a baseline |
| Standalone pooler (PgBouncer) | Multiplex across many app instances | Traditional server-based architectures with many replicas |
| Managed proxy (RDS Proxy) | Fully managed pooling + failover + IAM auth | Serverless, Lambda, highly concurrent, or cloud-native workloads |
In practice, such systems are often implemented using a combination of layers. One common pattern is to have a relatively lightweight process for handling individual connections at the application layer (to avoid excessive overhead), while using a central proxy (such as RDS Proxy or PgBouncer) to manage and limit the number of connections actually used by the database engine. This can give you much more flexibility, by decoupling the connection limits of your application fleet from the overall limits of your database system.
Using Purpose-Built Databases
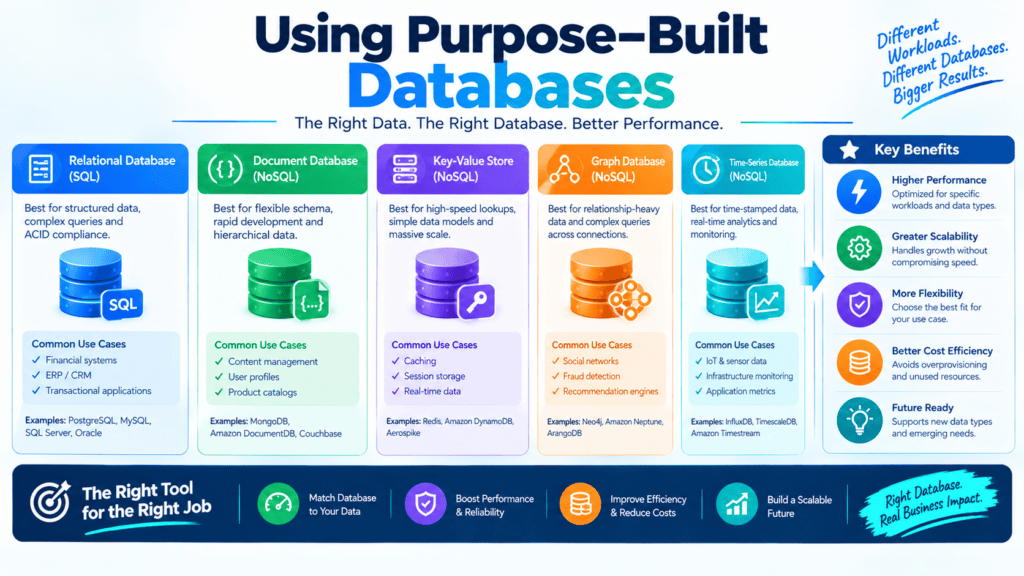
Choosing the right storage architecture is one of the most important structural decisions that you will make for an application. While a traditional relational database management system (RDBMS) such as PostgreSQL or MySQL is often the best default choice, relying on one engine for all workloads as a system grows and scales will result in performance, financial, and reliability bottlenecks.
Modern architecture is focused on purpose-built databases — the practice of choosing database engines that are fit for specific data shapes, access patterns, and performance characteristics.
When to Introduce Additional Database Technologies
Introducing new database engines adds operational complexity, monitoring overhead, and data synchronization challenges. You should only expand your database stack when your existing primary database encounters clear boundary conditions:
- High Write/Read Throughput Bottlenecks: The primary engine is unable to meet the required IOPS (Input/Output Operations Per Second) or latency targets without expensive hardware upgrades.
- Schema Rigidity & Varied Data Models: Forcing unstructured, highly nested, and graph structured data into relational tables results in complex joins and multi-table queries and maintenance pain.
- Analytical Query Strain: Heavy aggregations, long range scans, and analytical queries executed against the operational database causes locked rows, CPU exhaustion, and poor application end user performance.
- Extreme Latency SLA’s: The application requires sub millisecond response times globally that disk backed relational databases are unable to sustain.
Matching Databases to Specific Workloads
The key to purpose-built database architecture is mapping your data access patterns to the optimal database archetype.
| Database Class | Key Characteristics | Primary Use Cases | Common Technologies |
| Relational (RDBMS) | ACID compliance, strong consistency, schema enforcement, SQL support | Core business logic, transactional systems, financial records | PostgreSQL, MySQL, Amazon Aurora |
| Key-Value & Document | High throughput, horizontal scale, flexible schema, low-latency access | User profiles, sessions, product catalogs, caching | DynamoDB, MongoDB, Redis |
| Data Warehouse | Columnar storage, massive parallel processing (MPP), analytical queries | Business intelligence, historical analytics, enterprise reporting | Snowflake, BigQuery, Amazon Redshift |
| Search Engine | Inverted indexing, full-text search, complex filtering, log aggregation | Search bars, log management, real-time analytics | Elasticsearch, OpenSearch |
| Graph | Node-and-edge structures, fast relationship traversals | Social networks, fraud detection, recommendation engines | Neo4j, Amazon Neptune |
| Time-Series | Optimized for append-only time-stamped data, high write ingestion | Metrics monitoring, IoT sensor streams, financial market data | TimescaleDB, InfluxDB |
NoSQL Databases for High-Throughput Workloads
Relational databases scale vertically (CPU and RAM) which makes them expensive and limited when the volume of work is high. The NoSQL databases are designed to scale horizontally on a cluster of commodity computers which allows for more throughput and lower latency for such big data applications.
Key Drivers for NoSQL
- Flexible Schemas: Documents (e.g., JSON) can evolve rapidly with minimal overhead.
- Partitioning & Sharding: Key-value and document stores partition data according to a partition key so that queries can be answered in parallel.
- Low-Latency Reads/Writes: Because data is often denormalized, related data can be stored together in the same document so that an entire entity is accessed with a single read.
Data Warehouses for Analytics
Operational databases (OLTP) are tuned for fast, transactional row-based access (e.g. updating a user’s address), while analytical systems (OLAP) require querying millions of rows across a few specific columns (e.g. calculating average monthly revenue over five years).
Executing analytical queries on an OLTP database causes debilitating performance issues. Data warehouses solve this problem in that:
- Columnar Storage: Data is stored by columns instead of rows, so queries only need to read the specific attributes that are needed thereby greatly reducing disk I/O.
- Massive Parallel Processing: Queries are broken up and sent to dozens or hundreds of compute nodes to process petabytes of data in seconds.
- Separation of Storage and Compute: Modern cloud data warehouses allow clusters to scale up and down based on query needs without having to change anything about the underlying stored data
Specialized Databases for Specific Use Cases
Beyond standard document stores and data warehouses, certain domain-specific problems demand specialized database paradigms:
1. In-Memory Caching (Sub-Millisecond Speed)
Engines such as Redis store data in RAM in order to allow queries to occur at microsecond response times. They offer up a cache layer in front of primary databases, used to handle session state, leaderboards, and rate-limiting
2. Search Engines (Full-Text & Unstructured Search)
Operations such as the LIKE ‘%query%’ clause are not scalable, and furthermore, they do not support scoring or fuzzy matching. Search engines such as Elasticsearch implement inverted indexes over data to be searched to enable rapid full-text search, autocomplete, and log ingestions in real-time.
3. Graph Databases (Complex Relationships)
Querying highly interconnected data (e.g., “Find all friends of friends who bought product X”) in SQL requires time- and resource-intensive JOIN operations. By contrast, graph databases represent data as nodes (i.e., entities) and edges (i.e., connections) and allow for high-performance traversal of these connections.
4. Time-Series Databases (Append-Heavy Streams)
IoT telemetry, system metrics, and financial trading platforms commonly produce continuous streams of time- stamped events. Time-series engines typically exploit heavy compression to store these, while also giving built-in functions for time-bucket aggregation, retention policies and downsampling.
Verifying Your Database Scaling Strategy
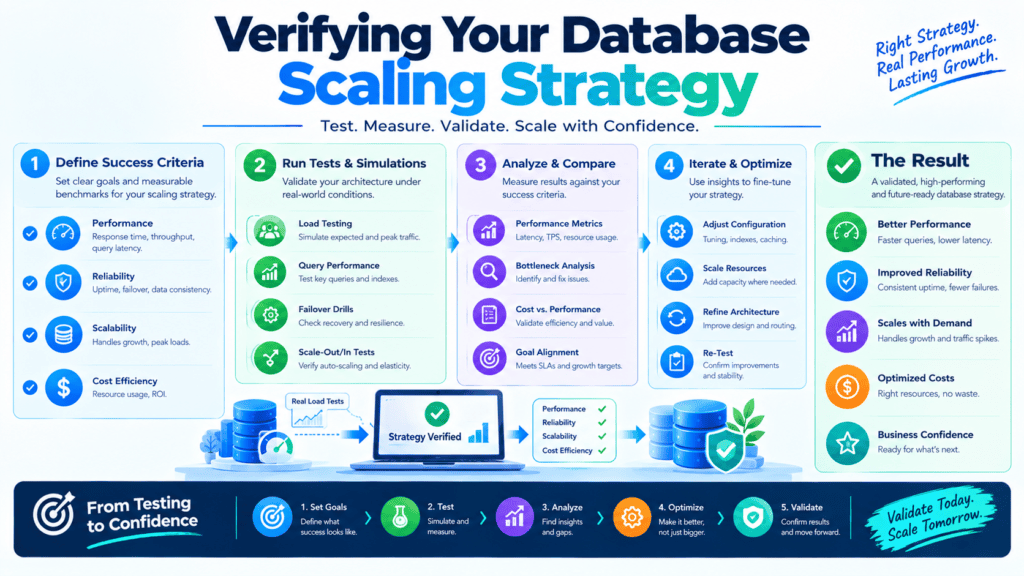
Scaling a database is rarely a one-time affair. Teams often find themselves adding read replicas, upgrading instance sizes, or sharding their data simply based on intuition or a single spike in latency, only to realize months later that it didn’t actually resolve the issue.
The effectiveness of a scaling strategy is only as good as the underlying basis for it. This post covers ways to verify that it’s working (or not), including performance testing, database performance, monitoring workloads, and knowing when to scale again.
1. Performance Testing: Prove It Before You Trust It
Before introducing any scaling change into production, it should be tested in a manner that reflects realistic conditions to ensure that it works correctly under expected loads and not just simple sanity checks with a few queries.
Load testing involves subjecting the database to loads beyond what one expects to see in normal operations to identify the point at which it will fail. Stress testing takes things further by attempting to push the system beyond its breaking point to obtain specific information about how and why failures will occur.
A few practices make this testing meaningful:
- Use production-like data volumes and schemas. A database with 10,000 rows in it is a fundamentally different problem than a database with 500 million rows. Things like index effectiveness, query planning, and lock contention scale unpredictably with data size.
- Reproduce realistic query patterns, and not just uniform mixes of “benchmark” queries. Tools like pgbench (for Postgres), sysbench (for MySQL) or simply recorded traffic replays can help significantly.
- Test scaling changes in isolation. If you’ve added a read replica, focus your tests on read-heavy workloads. If you’ve resharded your database, focus your tests on cross-shard queries, rather than queries that hit a single shard.
- Re-test after every significant schema or index change. The scaling characteristics of database workloads have a tendency to change drastically as the data model evolves.
The output of this step should be a clear answer to: at what point does this system start to degrade, and does that point match what we expected when we designed the scaling plan?
2. Database Performance Metrics: What to Actually Watch
Testing tells you how the system behaves under controlled conditions; metrics tell you how it behaves in the wild. The key is tracking metrics that reflect real bottlenecks, not vanity numbers.
Core metrics worth watching closely:
- Query latency (p50, p95, p99): median and tail latencies are critical metrics. While averages can be misleading, a spike in P99 latency is always noticeable by end-users.
- Throughput (queries/transactions per second): indicates whether your system is actually utilized to a greater extent or if it is just performing the same amount of work at a slower pace.
- Connection pool utilization: one of the most underrated sources of issues. Often, connection pools are exhausted and new connection attempts are timed out as “database is unreachable” instead of an internal DB issue.
- Replication lag: relevant if you have any form of database replication setup as a lagging replica set may cause stale reads.
- Cache hit ratio (buffer cache, query cache): typically, a low hit ratio indicates that your working set is bigger than your available memory.
- Lock waits and deadlocks: often, contention related issues manifest as lock waits or deadlocks which are not easily discovered by just looking at CPU and Memory utilization.
- Disk I/O and IOPS: relevant for write intensive operations or hitting limits of available throughput on storage subsystems.
The goal isn’t to stare at dashboards — it’s to set baselines for each metric under normal load, so deviations are obvious rather than buried in noise.
3. Monitoring Database Workloads: Understanding the “Why”
Metrics tell you that something is wrong; workload monitoring tells you why. This is where you connect performance numbers back to actual query behavior and usage patterns.
Effective workload monitoring includes:
- Query-level profiling — tools like pg_stat_statement, Performance Schema for MySQL or APM-integrations (Datadog, New Relic) can tell which particular queries use the most time and resources.
- Slow query log analysis — and not just the queries themselves but regular inspection of their trends.
- Traffic patterns — is your load more or less consistent throughout the day, or are there definite (end of month billing jobs, morning traffic surges), which may influence scaling needs in different ways.
- Read/heavy write ratio — critical in deciding what kind of optimizations to pursue, and if_replication_caching_sharding_even_is_a_good_idea.
- Hot partitions/keys — if you have a sharded architecture or a distributed database, it’s important to know if one shard is receiving disproportionately high traffic_queries_and_is_there_a_way_to_distribute_that_more_evenly.
This layer of monitoring is what turns “the database is slow” into “these three queries account for 80% of load, and they’re all hitting the same unindexed column.”
4. Knowing When Additional Scaling Is Required
This is where testing, metrics, and monitoring come together into a decision. Scaling too early wastes cost and adds complexity; scaling too late causes outages. Signs that indicate it’s genuinely time to scale further:
- The system is operating on a sustained load of more than 70-80% CPU, memory, or I/O utilization (not just spiking up occasionally).
- Latency is increasing steadily over time, even if there is no increase in the traffic load.
- Scaling up vertically seems to be producing smaller and smaller improvements in performance.
- The system is exhibiting replication lag, even under normal loads, not just in the event of a failover.
- Benchmarking queries show that the system is nearing the limits of its tested performance capabilities, under projected production loads.
A useful discipline here is capacity forecasting: project current growth trends (data volume, request rate, user count) forward 3–6 months and test against that projected load now, rather than reacting once it’s already been exceeded.
Bringing It Together
Verifying a scaling strategy isn’t a single checkpoint — it’s a loop:
Test → Measure → Monitor → Decide → Test again.
A strategy unproven by realistic, performance tested scenarios, with meaningful metrics, informed by actual workload patterns, and re-evaluated based on clear triggers for scaling is not a strategy, it is a feel-good exercise. Embedding that feedback loop directly into your operational routine is the difference between teams that scale proactively, and teams that scale in chaos.
Conclusion: Building a Scalable SaaS Database Architecture
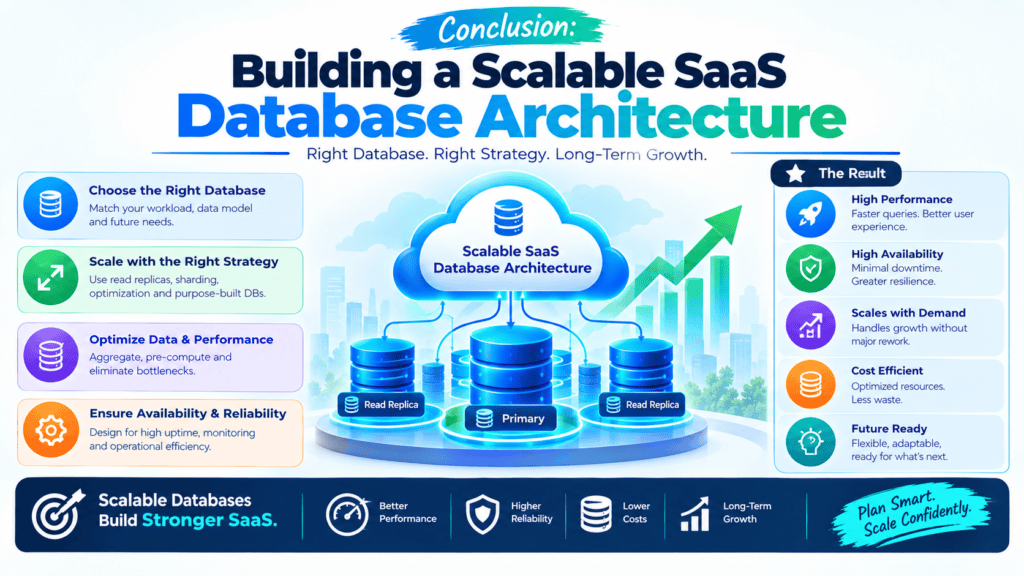
A well-designed SaaS database architecture is the invisible foundation that allows a product to grow from hundreds of initial users to hundreds of thousands of concurrent sessions. This layer must be reinforced and supercharged as the application scales to prevent downtime, data overlaps, and performance bottlenecks.
Core Pillars of Scalable SaaS Database Architecture
1. Strategic Data Isolation Models
Choosing how tenant data is stored dictates your database’s security boundaries and scaling trajectory:
- Multi-Tenant (Shared Database, Shared Schema): Same database and tables for all tenants but with logical isolation of data using the tenant_id column. It has a high level of resource efficiency and infrastructure simplicity, but has a significant risk of noisy neighbors and requires additional isolation logic in the application layer when reading/writing data.
- Hybrid (Shared Database, Separate Schemas): Same database instance but each tenant has its own set of schemas. It offers more isolation and simplicity in terms of tenant-specific database object management than the previous option while keeping infrastructure costs at a reasonable level.
- Siloed (Separate Databases): Each tenant has its own database instance. It offers the highest level of isolation and compliance with regulatory requirements, as well as making backups/restores easier on a per-tenant basis, but has high infrastructure and management costs.
2. Scaling Read and Write Workloads
To handle increased traffic without spiking query latencies:
- Read-Replication is used to divert heavy reads (such as analytics, reporting, dashboards) to the primary-replica set of reader nodes, leaving the main database instance free to handle writes.
- The database is horizontally partitioned/sharded using the same sharding key (typically something like tenant_id) so that individual partitions can be processed and indexed individually, maintaining acceptable performance per node. The data caches are moved up as much as possible (Redis, Memcached) to avoid reading from disk wherever possible.
3. Database Schema Migration Strategy
Zero-downtime deployment pipelines are essential for continuous delivery in SaaS environments:
- Decoupled Deployments: Leverage feature flags and non-breaking database schema alterations (e.g., expand-and-contract migration patterns) to allow database migrations to be executed independently of application code deployments.
- Automated Multi-Tenant Migrations: Pipeline tooling must execute migrations concurrently across schemas or isolated tenant databases incorporating automatic rollback triggers if error thresholds are exceeded.
Key Takeaway
Building a database architecture for a SaaS product is an iterative context optimization process between the need for high-performance, isolation and cost. Start with a clean multi-tenancy model with strong logical isolation and build out replication/caching strategies for reads/writes early. Design schema pipelines for zero downtime changes from day one
Author Bio
Jeevesh Tripathi actively creates content, covers various topics as a technical writer, and contributes to BkAbhi’s blogs as a software developer. He primarily focuses on modern software development, database design, and technical writing. As a technical writer, his main purpose is to simplify software engineering topics for developers and SaaS companies.
Jeevesh creates useful content about databases, technical writing, and software development. He covers critical topics, including database scalability, and approaches them from a technical writer and software development perspective. His articles help developers and SaaS companies better understand modern software development and improve their technical writing skills.